Trump rally pausing before Fed interest rate announcement
Updated 6:55 a.m.
While the Emini gapped above Friday’s high, which is the neck line of the 2 day double bottom, it failed to create bull bars on the 1st 2 bars. That lowered the probability of a trend from the open bull trend.
The context is good for the bulls. They therefore have a higher probability of a trend day than the bears. The 3 consecutive bull bars made the day Always In Long and the bulls have a 50% chance of a trend day. Yet, the bulls need more follow-through buying before traders become confident that this is the start of a strong bull trend day.
The bulls have been strong enough so that the bears will probably need at least a micro double top before they can create a swing down. The 1st reversal down will probably be minor. It therefore will probably be either a bull flag or a leg in a trading range.
Pre-Open Market Analysis
After last week’s new all-time high, the Emini has pulled back. Yet, the reversal down so far is weak. It therefore is more likely a bull flag than a new bear trend. Because the Fed’s FOMC interest rate hike announcement is on December 14, and the November rally was a buy climax, the Emini might remain in a narrow range until the report.
Because this pullback is a bull flag, the bulls can get a bull breakout at any time. While a reversal down is possible, it is not likely without more selling pressure. The bears would need either many more days in the trading range and then a major trend reversal top. Less likely, they could create a series of strong bear bars. Traders would therefore see those bars as a sign that then bulls were giving up.
Most likely, the Emini will be sideways, confused, and balanced going into the Fed meeting. This means that most days will continue to have a lot of trading range trading, and strong trend days will probably be rare.
Overnight Emini Globex trading
The Emini again tested below the August high last night. That is the breakout point for the 3 week rally. In addition, it reversed up strongly. Therefore, last week’s double bottom from just above the breakout point might remain open on the daily chart. The bulls might get a new high first. Yet, the odds are that the gap will close within a few weeks. This is because gaps rarely stay open for long when they form late in a trend.
Because the overnight reversal was strong and there is a double bottom on the day session chart, the odds of a trend day are higher today. While the bears want the 8 day tight trading range to continue at least until next week’s Fed interest rate announcement, the bulls want trend resumption up after their 12 day bull micro channel. Since trading ranges have inertia, the odds are that the trading range will continue into the FOMC meeting. Yet, there is room to the top of the range and the momentum up is strong. The odds favor higher prices over the next few days.
EURUSD Forex Market Trading Strategies
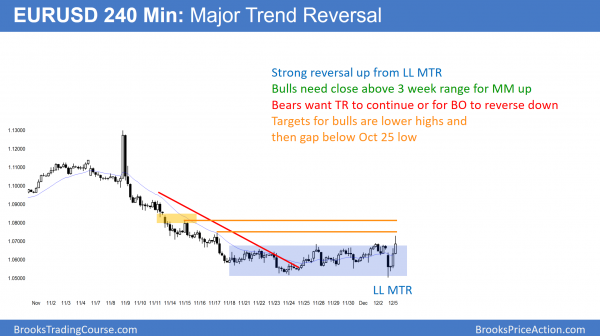
The EURUSD 240 minute chart reversed up sharply overnight from testing the November low. It therefore retested the December 2015 low.
The EURUSD daily Forex chart has been in a tight trading range for 11 days. Furthermore, it has created a wedge bear flag at the moving average. As more bars get added to this tight trading range, the probability of a bull breakout above this bear flag increases. The bulls therefore currently have more than a 40% chance of a bull breakout without 1st a bear breakout.
While the odds favor a bear breakout below the bull flag, they also favor limited selling. Because the EURUSD is holding support of the December 2015 low and the low of the 18 month trading range, the odds are that a bear breakout attempt would fail. As a result, the wedge bear flag would probably then be the final bear flag. The bulls would buy a reversal up, which would therefore be a major trend reversal.
What is most likely? Markets have inertia and therefore tend to continue to do what they have been doing. Since the EURUSD has been sideways for 12 days, it will probably be sideways again today. Furthermore, it might remain sideways until the Fed’s FOMC interest rate hike announcement in 2 weeks.
Overnight EURUSD Forex trading
I have written every day since the November low that the odds were that the bear breakout would fail. Furthermore, I said that the reversal up would be minor. Hence, it would probably go up about 200 pips, test the moving average on the daily chart, and then selloff again to test the December 2015 low. In addition, I said the odds were that this 2nd selloff would fail and that the bulls would try for a major trend reversal.
Last night was another step in the sequence. The EURUSD sold off strongly to below the November low and reversed up strongly. Hence, it formed a double bottom. Furthermore, the rally broke above the top of the 2 week range. It therefore broke above the neck line of the double bottom. Yet, it stalled. Swing traders will put their stop below the overnight low. They are therefore looking for a 200 pip measured move up.
Bears will sell the breakout, betting it will fail. Yet, the context and momentum are good for the bulls. Therefore the best the bears will probably get over the next several days is a trading range.
Nested double bottom
Trading ranges have inertia. As a result, most breakouts fail. We saw that at the December 2015 low. The selloff last night was strong. The reversal up formed a double bottom with the November low. Furthermore, the double bottom formed a larger double bottom with the December 2015 low. Finally, there are targets above after the November sell climax. There are the lower highs on the 240 minute chart. Most noteworthy is the October low, which is the breakout point. This is therefore a nested double bottom at a good location for the bulls. Hence, the probability of higher prices is greater.
Because trading ranges have inertia, the chart might stall here for a week or so. Especially relevant is next week’s FOMC report. That might limit movements in all financial markets until Fed announces its rate hike.
Summary of today’s S&P Emini futures price action and what to expect tomorrow
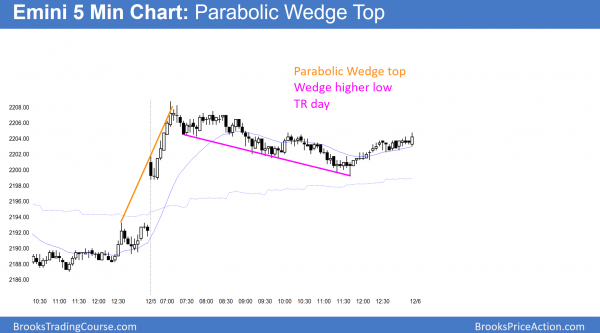
The Emini rallied to a measured move target. It then formed a parabolic wedge top, and entered a bear channel. It had a weak rally after a wedge bottom.
The Emini had an early parabolic wedge rally, yet it sold off. As a result, the day was a trading range day. The Emini will probably not go far up or down until next week’s FOMC report.
See the weekly update for a discussion of the price action on the weekly candlestick chart and for what to expect going into next week.
Traders can see the end of the day bar-by-bar price action report by signing up for free at BrooksPriceAction.com. I talk about the detailed S&P Emini futures price action real-time throughout the day in the BrooksPriceAction.com trading room. We offer a 2 day free trial.
When I mention time, it is USA Pacific Standard Time (the Emini day session opens at 6:30 am PST, and closes at 1:15 pm PST). You can read background information on the intraday market reports on the Intraday Market Update page.


