Trump, North Korea, Iran, Congress, and earnings are catalysts
Updated 6:54 a.m.
The Emini broke to a new all-time high on the open. However, there was selling above prior highs last week, and that therefore increases the chance of an early reversal down today. There is a measured move target on the daily chart at 2559.50.
Since Friday was small, there is an increased chance that today will reverse down and trade below Friday’s low. That would be an outside down day.
At the moment, the Emini is trying to get to the measured move target above. Yet, the 1st bull bars have had bad follow-through. That reduces the chances of a big bull trend day. The bears have been unable to create a strong reversal down. That reduces the chances of a big bear day. Therefore, the Emini will probably form another mostly sideways day.
It is still early, and there is time for a strong breakout up or down. However, the quiet open makes a trading range day likely. Since the Emini is rallying, the odds are that it will not get too far up before it stalls and enters a trading range or has a bear swing.
Pre-Open market analysis
Last week was a small bar on the weekly candlestick chart after a big bull trend bar. It is therefore bad follow-through after a buy climax. Hence, it is a sell signal bar for this week.
In addition, the weekly chart has never been this overbought in the history of the Emini. Consequently, the context is good for a pullback. Furthermore, the odds are against a big rally this week.
Since most of the trading over the past 6 days has been within trading ranges, the odds are that this week will also have a lot of trading range trading. However, because a pullback on the weekly and monthly charts will probably begin within the next few weeks, traders should be ready to swing trade if a strong selloff begins on the 5 minute chart.
Overnight Emini Globex trading
The Emini is up 2 points in the Globex market. However, the trading over the past 6 days has been mostly sideways. The odds favor more trading range days.
Friday was the 3rd leg up in a 6 day wedge. Also, the wedge followed an extreme buy climax in October on the daily chart. Finally, the weekly and monthly charts have even more extreme buy climaxes. This increases the odds of a surprisingly big bear trend day coming at any time.
In addition, since a big bull trend day should be unlikely within this context, the odds are actually greater than they appear. This is because traders will bet against it as it unfolds, and the results can be a Black Swan day. «Low» probability events are more common than «logic» would have traders believe.
In conclusion, while another trading range is most likely, there is an increased chance of either a very big bull or bear trend day this week.
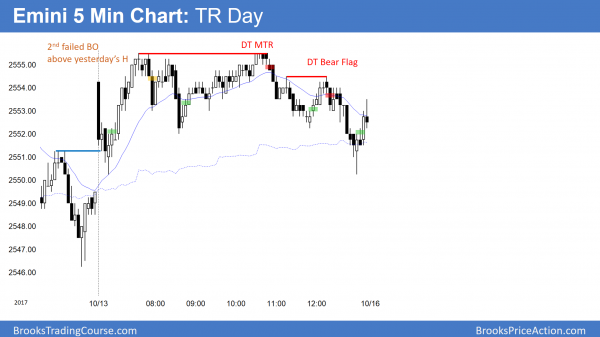
Friday’s setups
Here are several reasonable stop entry setups from Friday. I sometimes also show limit order entries and entries on the close of bars.
EURUSD Forex market trading strategies
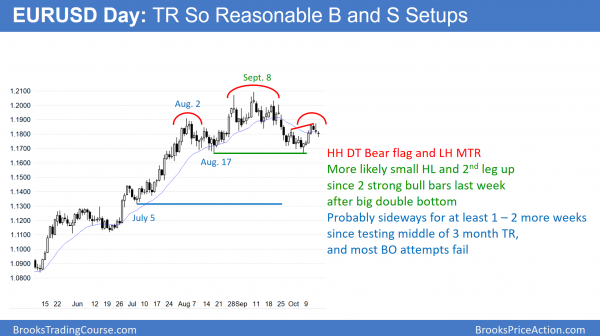
The EURUSD daily Forex chart pulled back after last week’s string reversal up. The odd favor a 2nd leg up and a continued trading range.
The EURUSD daily Forex chart has been in a trading range for 3 months. Trading ranges always have both a reasonable buy setup and a reasonable sell setup. Most breakouts fail, and therefore these setups usually fail and are replaced by other buy and sell setups.
The bulls reversed up from the August 17 low 2 weeks ago, forming a big double bottom bull flag. The chart had consecutive big bull bars closing on their highs. That reversal up was strong enough to make at least a small 2nd leg sideways to up likely this week. This is especially true because the 2 day pullback is made of doji bars instead of strong bear bars. Hence, the odds favor at least 1 – 2 day small leg up starting in the next 3 days.
The bears have a 3 month head and shoulders top. Last week’s rally is the right shoulder. This is also a lower high major trend reversal. Finally, Thursday high formed a small higher high double top bear flag with the September 29 lower high.Major trend reversals have a 40% chance of leading to a major reversal after they break out. Since this one has not yet broken out, the odds favor a continuation of the range.
Overnight EURUSD Forex trading
The 5 minute chart reversed up slightly overnight from its 3 day pullback. Friday was a doji bar on the daily chart, and today so far is another one.
In addition, the past 3 days have been small. This is trading range behavior, and it therefore increases the odds of another small trading range day again today. However, the daily chart is likely to have a 2nd leg up starting this week. Furthermore, the rally will probably be about the same size as lat week’s rally. Therefore, the bulls will be looking to hold part of their longs for a 100 – 200 pip swing trade up.
While the bears might swing part of their short positions, they know that shorting at the bottom of a 3 month trading range is a low probability bet. Most will therefore only scalp until there is a strong reversal down. Many will wait to sell after a strong breakout below the bottom of the range, or from a reversal down from near the top of the range.
Summary of today’s S&P Emini futures price action and what to expect tomorrow
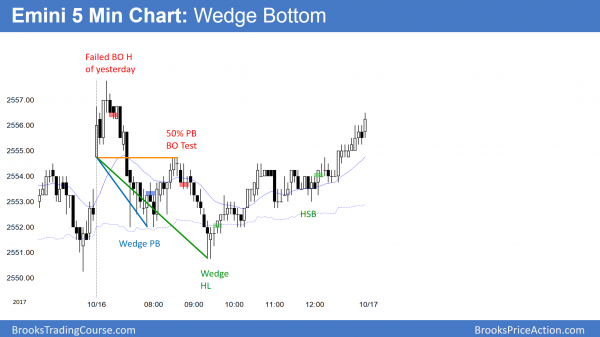
While today sold off from above yesterday’s high, it reversed up from a wedge bottom and formed another trading day.
The daily, weekly, and monthly charts are in buy climax. The 7 day small wedge top is a minor sell setup. But, after an extreme buy climax on the daily chart, there is an increased risk of a major reversal down. The 1st target is the 2500 low. Yet, the weekly and monthly charts are extremely strong, despite the buy climaxes. Consequently, the best the bears will probably get is a 1 – 3 month pullback. That would create a bull flag on the monthly chart.
See the weekly update for a discussion of the price action on the weekly candlestick chart and for what to expect going into next week.
Traders can see the end of the day bar-by-bar price action report by signing up for free at BrooksPriceAction.com. I talk about the detailed S&P Emini futures price action real-time throughout the day in the BrooksPriceAction.com trading room. We offer a 2 day free trial.
When I mention time, it is USA Pacific Standard Time (the Emini day session opens at 6:30 am PST, and closes at 1:15 pm PST). You can read background information on the intraday market reports on the Intraday Market Update page.


