Emini daily chart triangle
Updated 6:50 a.m.
While today began with a trend from the open bull trend, the initial bars were not especially big and the Emini is testing the top of the trading range. Because the rally is reasonably strong, the best the bears will probably get over the next hour is a trading range.
The Emini is Always In Long, yet, not especially strong. While this could be the start of a big bull trend day that breaks far above the trading range, the odds are against it. It is more likely that this will be a trading range open for an hour or two. The bears will try to create a major trend reversal, while the bulls will try to create a double bottom or wedge bull flag. Since the momentum up since the middle of Friday has been moderately strong and there is no rejection of these high prices, the odds are against a strong bear trend day, at least for the 1st 2 hours.
Pre-Open Market Analysis
The Emini has been in a triangle for 3 weeks and is therefore in breakout mode. Hence, the odds of a rally to a new high are the same as for a selloff below the July 2015 top of the trading range. While Friday reversed up from the bottom of the 3 week range, the rally was not strong enough to break out of the range. Therefore, it did not increase the probably of a bull breakout.
Overnight Emini Globex trading
The Emini is up 11 points in the Globex session. It is therefore near the top of the 5 day range, which is within a 3 week tight trading range. While Friday ended with a strong bull reversal and today will gap above Friday’s close and maybe above Friday’s high, the bulls need a strong breakout above the range. Otherwise, the bears will continue to see the past 4 weeks as a bear flag and will therefore sell strongly near the top.
Forex: Best trading strategies
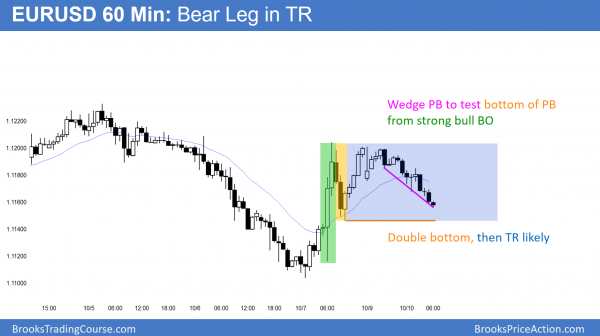
The 60 minute EURUSD chart sold off overnight. Yet, there was bad follow-through after every big bear bar, and the selloff is near a level where the EURUSD rallied sharply last week.
Because the overnight selloff lacked consecutive big bear bars, it is more likely a bear leg in a trading range than the start of a bear trend. Furthermore, the pullback after the October 7 bull breakout was deep. That also increased the chances of a trading range. While it is possible that the bears will break strongly below that pullback and test the bottom of the bull reversal, it is more likely that it will bounce from that level.
Daily chart is in Breakout Mode
The daily chart has been in a broad wedge channel since August 8. The bears want a strong breakout below the 1.1104 bottom of the wedge and then a measured move down. Yet, the bulls will buy to make this selloff to fail. They then want a measured move up above 200 point range.
While every selloff looks like the start of a bear trend and every rally looks like the bottom of a bull flag or trading range, there is no breakout. Since trading ranges are neutral, the probability for the bulls and bears is 50%.
Because of all of the reversals, traders are not holding positions for more than a couple of days. They correctly expect every rally and selloff to soon reverse. Yet, because there is now a wedge or triangle, the believe the breakout will come soon.
Summary of today’s S&P Emini futures price action and what to expect tomorrow
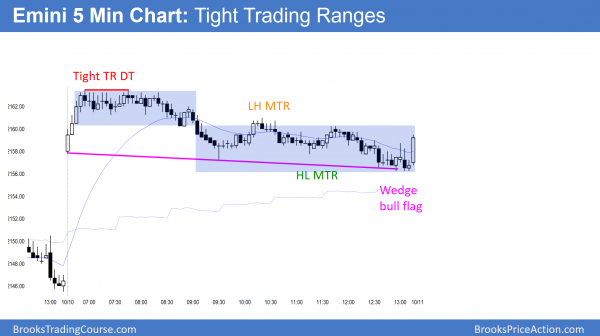
After rallying for 4 bars to test the top of the 5 day trading range, the Emini traded down in a weak bear channel all day. It reversed up from a Wedge Bull Flag on the last bar of the day, but spent most of the day within tight trading ranges.
The Emini gapped above yesterday’s close and the 60 minute moving average. Yet, the rally lasted 4 bars and the bears then created a weak bear trend day. Nothing has changed because the Emini is still in the middle of a month-long trading range.
See the weekly update for a discussion of the price action on the weekly candlestick chart and for what to expect going into next week.
Traders can see the end of the day bar-by-bar price action report by signing up for free at BrooksPriceAction.com. I talk about the detailed S&P Emini futures price action real-time throughout the day in the BrooksPriceAction.com trading room. We offer a 2 day free trial.
When I mention time, it is USA Pacific Standard Time (the Emini day session opens at 6:30 am PST, and closes at 1:15 pm PST). You can read background information on the intraday market reports on the Intraday Market Update page.


