Stock market April seasonally bullish Trump rally resumption
Updated 6:47 a.m.
Today opened in the middle of yesterday’s range. In addition, it is in the middle of a month long tight trading range. Furthermore, the 1st bar had prominent tails. The limit order bulls made money buying on the 3rd bar. Finally, a channel usually evolves into a trading range. These factors increase the chance of a trading range day.
In addition, yesterday had a big range. This therefore increases the chances that today will be an inside day. Consequently, if so, it will test the high or low, fail to breakout, and then reverse and test the other extreme. Finally, if it is an inside day, with today opening in the middle of yesterday, there is an increased chance that today will close around the open and form a doji day. Hence, if today is a trading range day, the open will be a magnet after 11 a.m.
At the moment, the Emini is barely Always In Short. Yet, there is not enough evidence to conclude that it has begun a swing down to test yesterday’s low. Furthermore, there is no evidence yet that today will be a strong trend day. In fact, the early evidence favors a trading range day.
Pre-Open market analysis
Yesterday sold off in a broad bear channel, yet held above Tuesday’s higher low. Therefore the bulls are still hopeful that they will have a swing up from the 60 minute wedge bottom. Consequently, the bears need a strong break below Tuesday’s higher low to convince traders that the wedge bottom might fail.
The odds favor the bulls over the next week. Because the wedge bottom was a test of the bottom of the 2 month trading range, there is a higher probability of a test of the top of the wedge.
Since yesterday’s selloff was in a series of sell climaxes, there is only a 25% chance of a strong bear trend day today. Yet, there is a 50% chance of some follow-through selling in the 1st 2 hours.
Because a bear channel is a bull flag, there is therefore a 75% chance of a bull breakout. Furthermore, there is a 75% chance of at least 2 hours of sideways to up trading, starting by the end of the 2nd hour.
Daily chart in early bear trend
I have been saying for several weeks that the Emini would probably rally into the end of the month and test one or more of the lower highs on the daily chart. In addition, I have been saying that it is probably in an early bear trend. Consequently, it will probably fall to the December close at some point over the next 2 months. This is true whether or not it tests the March 15 lower high 1st. There is only a 25% chance of a strong rally above the all-time high without first pulling back to the weekly moving average.
Overnight Emini Globex trading
The Emini is up 5 points in the Globex market. It will therefore probably open above yesterday’s bear channel. Since channels usually transition into trading ranges, this is probably the start of a trading range. The odds are that yesterday’s selloff was simply a test of Tuesday’s low. Hence, the 60 minute chart is probably trying to form a double bottom higher low major trend reversal.
EURUSD Forex market trading strategies
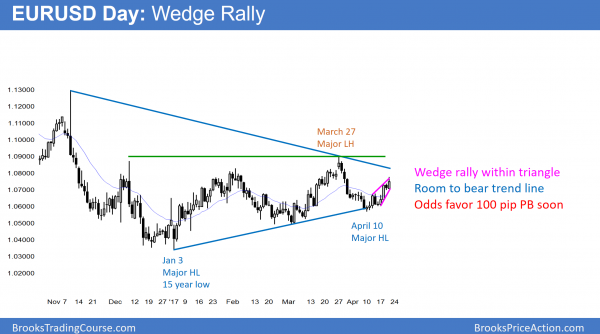
The 240 minute EURUSD Forex chart has a wedge rally within a 6 month triangle.
The EURUSD Forex market rally on the daily chart from the bull trend line has 3 pushes up and is therefore a wedge. Therefore, the odds are that it will correct down to support over the next few days. Since support is at last week’s lower high and 50%, it should correct about 100 pips.
While there is room to the bear trend line above, the wedge top makes it more likely that it will correct down in a couple small legs before deciding what to do next.
Overnight EURUSD Forex trading
The EURUSD reversed down overnight about 40 pips from its 3rd push up in the wedge rally. Because the 3 legs within the 2 week rally have been strong, it might go sideways for a couple of days before pulling back. Consequently, it might form a micro double top. Yet, the wedge rally within a 6 month triangle make a pullback likely within the next couple of days.
Summary of today’s S&P Emini futures price action and what to expect tomorrow
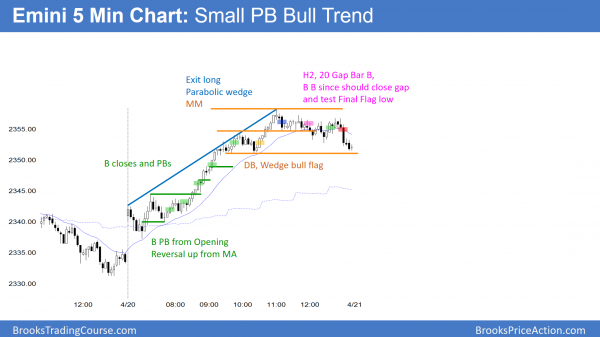
The Emini had a small pullback bull trend today. It ended with a parabolic wedge top. The reversal down tested the bottom of the final bull flag.
The Emini had trend resumption up today after the March 27 rally. While the rally will probably test the lower highs on the daily chart, the odds are very high that the Emini will fall below the weekly moving average within a month or two. Hence, this is a bear rally.
See the weekly update for a discussion of the price action on the weekly candlestick chart and for what to expect going into next week.
Traders can see the end of the day bar-by-bar price action report by signing up for free at BrooksPriceAction.com. I talk about the detailed S&P Emini futures price action real-time throughout the day in the BrooksPriceAction.com trading room. We offer a 2 day free trial.
When I mention time, it is USA Pacific Standard Time (the Emini day session opens at 6:30 am PST, and closes at 1:15 pm PST). You can read background information on the intraday market reports on the Intraday Market Update page.


