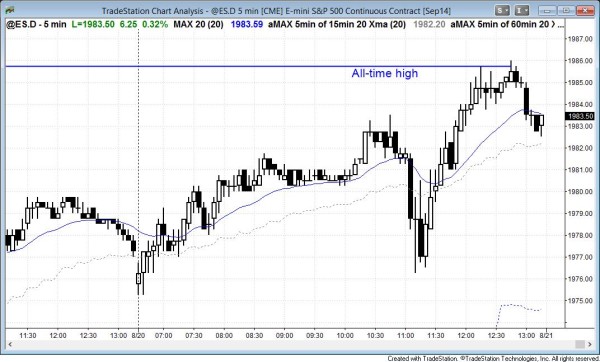
I posted this chart after the close. The S&P500 Emini sold off at 11 a.m. PST on the report, but then reversed up strongly to a new all-time high. There was a pullback into the close.
End of day comments
The Emini rallied until just before the 11 a.m. report. The stock market reversed down sharply for two bars and then reversed back up. This reversal up is because last month’s high is a strong magnet above. The Emini went above and therefore form an outside up candle on the monthly chart. The market pulled back into the close and failed to close above the July high. Because the monthly chart is so overbought, there probably will not be much follow-through buying.
S&P500 Emini intraday market update
Time of update 8:28 a.m. PST.
The S&P500 Emini became always in long for day traders on the second bar of the day. The bulls want the Emini to go above last month’s high and form an outside up candle on the monthly chart. There were three pushes up in the first 90 minutes, but the rally was in a tight channel and had many bull bars closing on their highs. This made a bear trend reversal unlikely until there was more selling pressure.
Bears who want smaller risk take the first short entry, like possibly below the 8:20 bar. However, their probability is low. Bears who want higher probability have to pay for it with greater risk. They will wait for a strong bear breakout and then short.
Bulls want the bull trend channel to continue up all day and to get above the all-time high. At the moment, the Emini is always in long, but there is enough selling pressure so the the Emini will probably enter a trading range soon. It might then stay there until the 11 am report. At that point, it would decide between trend resumption up or trend reversal down.
Yesterday ended with a 16 bar bear microchannel (16 bars without a pullback, which means the high of every bar failed to get above the high of the prior bar). This was enough selling pressure to limit the upside potential early on. Since it formed in a strong bull trend, at least some sideways price action on the open was likely (big up, big down, so confusion and disappointment, which are the hallmarks or trading range price action).
The 5 minute Emini chart is overbought and the FOMC minutes will be released at 11 a.m. PST today. This report could be the excuse for the S&P to pullback for 10 to 20 points. The Emini might first rally up to the all-time high before pulling back, but a pullback is likely soon since the rally has gone on for many bars without much of a pullback. Also, whenever any market tests an important high, it usually pulls back before deciding whether to breakout or reverse. Scale in bulls take profits around their original entries, and bears short. This selling usually results in at least a small pullback.
The rally on the daily chart is so strong that the Emini will probably go above last month’s high and create an outside up month on the monthly chart (see below). Because the Emini is so close to the all-time high, it might have one more push up to get there today. If it then reversed, this would be a nested wedge pattern. There would be a 60 minute wedge where the third leg up subdivided into a smaller wedge. A nested pattern has a higher probability of succeeding, which means that there would be a higher probability of TBTL SD on the 60 minute chart (Ten Bars, Two Legs, Sideways to Down).
S&P500 Emini daily and weekly candle charts
The Emini is being vacuumed up to the all-time high. In July, the bears created a bear reversal bar on the monthly chart. The bulls are trying to erase that sign of strength by the bears by having the S&P500 go back above the July high and create an outside up bar. Since the Emini is very overbought on the monthly chart, this would be much less bullish than a similar bar earlier in the move (for example, October, 2011, and even February, 2014).
As I wrote in the weekly update, the monthly chart is very overbought and this limits the upside over the next several months. Robert Shiller is one of my favorite academics and yesterday he said, «Everything is pricey.» Although any market can go much further than anyone thinks, the probability of much higher prices on the monthly chart without at least a small pullback becomes much less when the market is as extremely overbought as it is. The odds favor a 100 – 200 point trading range and a test of the moving average over the next 3 or more candles (next 3 – 6 months).
See the weekly update for a discussion of the weekly chart.
Traders can see the end of the day bar-by-bar price action report by signing up for free at BrooksPriceAction.com. I talk about the detailed Emini price action real-time throughout the day in the BrooksPriceAction.com trading room, and a 2 day free trial is available.
When I mention time, it is USA Pacific Standard Time (the Emini day session opens at 6:30 am PST, and closes at 1:15 pm PST). You can read background information on the intraday market reports on the Intraday Market Update page.

