Posted 7:07 a.m.
The bulls tried for bull trend resumption on the open, but the rally was weak. Also, yesterday’s 5 hour tight trading range after a buy climax is a possible final flag. It is an area where bulls and bears agreed that the price was fair. The bulls need to break strongly above it to change everyone’s minds. Without a strong bull breakout with follow-through, the Emini will probably get pulled back into that trading range at some point today.
As I am writing, the Emini is Always In long and it is trying to repeat yesterday’s weak initial rally, hoping for another strong bull breakout. This is unlikely. More likely, the Emini will enter a trading range today that will last at least a couple of hours. There is no sign of a top yet, but the Emini is close to a measured move from yesterday’s low to the middle of the big gap bar. Day traders will look for a reversal down and then a trading range. A strong bear trend day or bull trend day are less likely.
My thoughts before the open: Learn how to trade a strong breakout
The bull breakout above yesterday’s tight bull channel was very strong and unusual. That makes it important and likely to lead to a swing trade. It is likely to lead to a measured move up, either based on the height of the bar or on the bar being a measuring gap (the projection up is at the all-time high). However, whenever there is an unusual bar, online day traders always have to be aware that in about 30 – 40% of cases, the exact opposite of what is likely happens. It could be an exhaustion gap and it could be followed by at least a measured move down.
The Emini is up slightly in the day session and the bulls want follow-through buying today. The bears want to close the gap, which means that they want a selloff to below the high of the bars just before the breakout. This is at 2090.00. Remember, today is rollover day and September now is the front month. Will today be a big trend day? Probably not because the daily chart is still in a trading range and it is more likely that the follow-through will be bad. It is more likely to be a trading range day.
However, since the reversal up from the 100 day moving average was strong, the trading range is very tight and in breakout mode, and the all-time high is just above, today could quickly rally up to the target. It is also possible that the reversal up yesterday could reverse down today, but the reversal was so strong that a trading range day and possibly some follow-through buying at some point today is more likely.
Summary of today’s S&P Emini futures price action and what to expect tomorrow
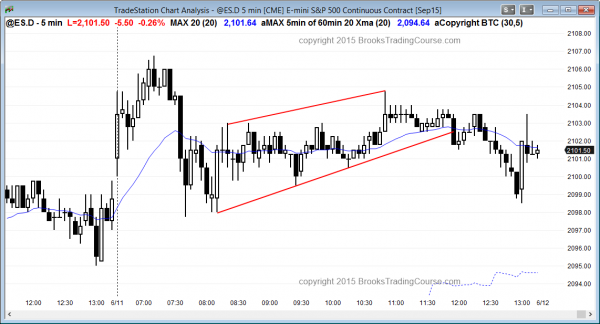
The Emini had a Final Bull Flag reversal down from the early breakout above yesterday’s tight trading range. It was in a small trading range for most of the day, and had a 2nd leg down at then end of the day.
The Emini was in a small trading range day. Yesterday’s strong bull breakout is controlling the current price action, and the odds favor follow-through buying over the next couple of days. Traders have to be aware that there is a 40% chance that it was a bull trap and the the Emini will instead reverse down. The most important economic event is next Wednesday’s FOMC meeting, and it could lead to a big move up or down, or both. The Emini has been in a quiet trading range for most of two days and that increases the chances of more trading range price action tomorrow. Tomorrow is Friday so weekly support and resistance can be important, especially in the final hour.
Best Forex trading strategies
The Euro is oversold on the 60 minute chart. It is turning up from a double bottom bull flag against the dollar. The EURUSD 5 minute chart also reversed up today. The reversal is strong enough so that traders learning how to trade the markets should consider buying a pullback for a 2nd leg up. The pattern on the GBPUSD is even stronger and should offer good Forex trading for beginners. They should consider buying a pullback for a swing trade up.
The USDJPY reversed down on the report this morning and is bouncing, but the reversal down is strong enough to that the best the bulls will probably get is a trading range. However, the bounce is big enough to make a trading range likely.
The USDCAD 240 minute chart is in a broad bear channel that is a pullback from the May rally. It probably has to transition into a small trading range before it can test up. The 5 minute chart is similar to the USDJPY. There was a rally overnight, and then a strong reversal down on the report 30 minutes ago, and now there is a bounce that is big enough to make a trading range likely.
See the weekly update for a discussion of the price action on the weekly candlestick chart and for what to expect going into next week.
Traders can see the end of the day bar-by-bar price action report by signing up for free at BrooksPriceAction.com. I talk about the detailed S&P Emini futures price action real-time throughout the day in the BrooksPriceAction.com trading room, and a 2 day free trial is available.
When I mention time, it is USA Pacific Standard Time (the Emini day session opens at 6:30 am PST, and closes at 1:15 pm PST). You can read background information on the intraday market reports on the Intraday Market Update page.


