Presidential election selloff through 2100 support
Updated 6:43 a.m.
Because of yesterday’s reversal, today will probably be a trading range day. This is especially true because most days for 4 months have been trading range days. Furthermore, today’s FOMC announcement at 11 a.m. creates added uncertainty. The odds are very high that the Fed will do nothing until December. As a result, the announcement will probably result in a trading range. Yet, that range will probably have big, fast swings.
Since today opened in the middle of yesterday and yesterday was a big day, today will probably be a trading range day. While the Emini reversed up and then down in the 1st 3 bars, unless there is a strong breakout up or down, the odds favor a trading range for the 1st hour or two, and a trading range day. It might go sideways within yesterday’s bull channel before breaking out up or down. Since most trading range days have at least one swing up and one down, today will probably have swings. Yet, the odds are against a big trend day up or down.
Pre-Open Market Analysis
Yesterday was a strong bear trend day. It broke below the October low and 2100. Today is therefore important. The bulls want a failed breakout. Hence, they want today to be a bull day. Furthermore, they want a big bull day. Yet, the bears always want the opposite. At a minimum, they want today to have a bear body. If they get it, it would confirm the bear breakout. It would therefore increase the chances of lower prices over the next few days.
Correction below July 2015 high?
Is this the start of the 100 point correction to below the July 2015 high? It certainly is strong enough. The probability of a drop below that high before a reversal up is now at least 60%. Despite the strength of yesterday’s selling, the odds are that there will be buyers around 2050. However, as I have said many times over the past few months, the 100 point selloff can be very fast and come over just 2 – 5 days.
The daily chart had a double top in a tight trading range in August. I wrote many times that this type of top often leads to 2 legs down. Furthermore, I wrote that the 2nd leg is often big and fast. Yet, bulls typically buy the sell climax, and there is then a reversal up. So far, the Emini daily chart is consistent with this pattern. If it falls to around 2050, the bulls will probably buy the selloff. This would therefore create a year end rally.
FOMC Meeting and possible Fed interest rate hike
Most traders believe that the Fed will not raise rates tomorrow because of next week’s election. Therefore, if they instead raise rates tomorrow, a very low probability event will take place. The result could be a huge move in the market. Given the top that is in place, yesterday’s selloff, and the magnet of the 2015 high, the odds are that the move would be down. Yet, the odds also are that bulls will buy around 2050, so any selloff will probably last only 1 – 5 days.
Overnight Emini Globex session
The Emini is down 5 points in the Globex session. Yet, it traded in a narrow range last night. Yesterday had a sell climax. That usually leads to 2 hours of sideways to up trading, which the bulls created at the end of the day. Now, there is a Big Down, Big Up, Big Confusion pattern. This means that today will probably be mostly a trading range.
Although yesterday was a strong bear trend day, it is especially relevant that the day closed with a big tail on the bottom. This weakens the bear case. Yet, as I have been saying for 2 months, the odds still favor a break below the July 2015 high before a rally to a new high. The bulls will probably come back between 2040 – 2050. There is a 25% chance that the selloff would continue to the July 1 low of 1975.00 or lower before a test of the all-time high.
Forex: Best trading strategies
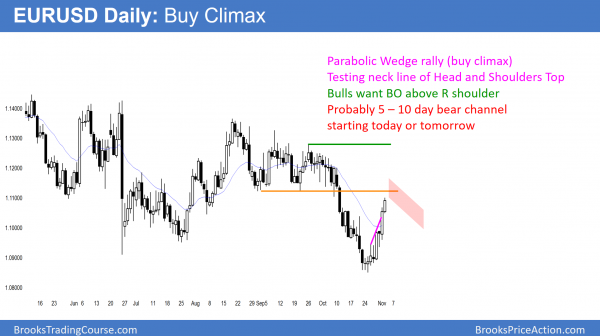
The EURUSD Forex daily chart has had a strong rally for 7 days. Yet it is a tight bull channel with 3 pushes up. It is therefore a Parabolic Wedge Buy Climax, testing the neck line of the Head and Shoulders Top.
Yesterday was a strong bull trend day. Yet, it was also a buy vacuum test of the October 13 bear channel high. This is therefore a resistance area. Hence, the rally will probably stall here for a couple of days. Furthermore, with the uncertainty of the election, all financial markets might enter trading ranges going into the election results.
Overnight EURUSD Forex sessions
The 7 day rally continued up strongly overnight. Hence, it is a buy vacuum test of resistance at the bottom of the October trading range. While there is no sign of a top, a Parabolic Wedge rally is a buy climax.
The rally can continue above the right shoulder of the Head and Shoulders top. If it does, it will hit the stops of the bears. Hence, it could then continue above other lower highs on the daily chart.
As a result of the developing buy climax in a 2 year trading range, a pullback is more likely. After a Parabolic Wedge Top, the chart usually enters a tight bear channel for 5 – 10 days. The bulls hope for a bull breakout above that bear flag. Yet, if the pullback continues for 10 – 20 bars, the probability of a bear breakout becomes equal to that of a bull breakout. Because the rally is at resistance, the pullback will probably begin this week.
Summary of today’s S&P Emini futures price action and what to expect tomorrow
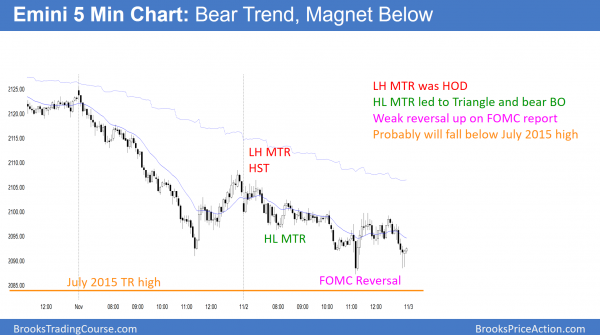
The Emini sold off in a broad bear channel, but bounced after the FOMC report.
While the Emini is trying to form a double bottom above the July 2015 high, it is now so close that it probably cannot escape the magnetic pull. The odds are that it will fall below that high to the next level of support in the 2040 – 2060 area. Because of the tight trading range double top on the daily chart, this 2nd leg down can be fast. Yet, the monthly chart is still in a bull trend. In addition, strong 2nd legs down from tight trading range double tops typically reverse up sharply. As a result, if the Emini falls another 50 points over the next week, bulls will probably buy it.
See the weekly update for a discussion of the price action on the weekly candlestick chart and for what to expect going into next week.
Traders can see the end of the day bar-by-bar price action report by signing up for free at BrooksPriceAction.com. I talk about the detailed S&P Emini futures price action real-time throughout the day in the BrooksPriceAction.com trading room. We offer a 2 day free trial.
When I mention time, it is USA Pacific Standard Time (the Emini day session opens at 6:30 am PST, and closes at 1:15 pm PST). You can read background information on the intraday market reports on the Intraday Market Update page.


