President Trump stock market rally
Updated 6:55 a.m.
While the Emini gapped up and began with a Trend From the Open, Buy The Close Bull Trend, it is at the top of a 15 minute bull channel. There is only a 25% chance of success. Hence, there is a 75% chance of a sideways to down move to the bottom of the channel. It typically begins within 5 bars. On the 15 minute chart, that is a little more than an hour.
The bulls are trying to reach a new all-time high. Yet, the 5, 15, and 60 minute charts have consecutive buy climaxes. Furthermore, the 15 minute chart is at the top of the channel. While this initial rally is strong, the odds are that the Emini will soon begin to trade sideways to down to the bottom of the bull channel. It might close the small gap below the day’s low.
Pre-Open Market Analysis
The Emini rallied strongly yesterday after the election. Furthermore, the Globex session reversed up from a 100 point selloff that fell below my bear target of 2040 – 2060. Therefore the odds favor a test of the all-time high. Because the Emini is testing the top of the September trading range, it might go sideways for a few days. Yet, the odds are that it finished its 100 point correction after the 7 consecutive bull bars on the monthly chart. In addition, it closed the gap above the July 2015 high.
Why a Trump rally?
The market is rallying for many reasons. Yet, none is important to traders. They only care about making money. It is possible that the market overly discounted a Trump will and has to go up to a more neutral price. More likely, people are realizing the obvious. Politicians lie to get elected. As a result, the market might have decided that Trump will not do the dangerous things it feared.
The most important force behind the rally is the 7 months strong bull trend on the monthly chart. I have talked about that for months. It did not matter who got elected. The market told us that it would fall about 100 points to below the July 2015 high, and then rally to test the all-time high. The election did not change anything.
Emini Globex session
The rally continued overnight in a series of buy climaxes. It got to with 5 points of the all-time high. While it is still up 9 points, it is 12 points below last night’s high.
As I have been writing since August, the odds were that the Emini would rally to test the old high if it fell 100 points to below the top of the July 2105 trading range. This is that test. Even if the bulls get a strong breakout to a new high, they will probably fail to create a strong trend. The odds are that the 2 year trading range will be the Final Bull Flag.
Because the momentum has been up strongly for 3 days, the odds favor the bulls again today. Yet, the 60 minute bars on the Globex chart are getting small. Furthermore, the tails are more prominent and the bars are overlapping. There are consecutive buy climaxes on the 5 and 60 minute charts. While the rally is still in effect, the bull channel will probably transition into a trading range today or tomorrow.
Forex: Best trading strategies
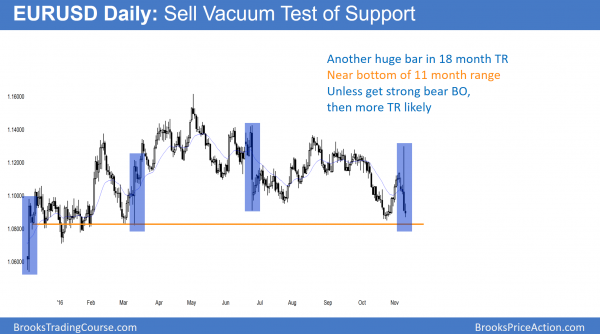
The EURUSD had a big bar yesterday. It has had many in its 18 month trading range. Yet, each failed to create a breakout.
The EURUSD Forex chart rallied 200 points on the initial election results. Yet, it then sold off almost 400 pips from the high. In addition, the reversal down came from just below the August high. It therefore formed another lower high in the bear trend that began in May.
Because it is still in the 18 month trading range, the odds are that it will continue mostly sideways. Yet, the reversal down was so big, the odds are that it will trade lower. As a result, will this lead to a breakout below the Low 2 bear flag on the monthly chart? Since 5 of the past months were doji bars, the odds still favor more sideways trading on the monthly chart.
But, the reversal down yesterday was strong enough so that the bears will sell the 1st bounce. Therefore, the EURUSD will probably be sideways to down for a few more days. Because the swings have been big, day traders are holding for 20 or more pips when scalping.
Overnight EURUSD Forex trading
While the 60 minute chart has traded down since the election results, the selloff over the past 24 hours has had small, overlapping bars with prominent tails. In addition, the slope is becoming flatter. Therefore, these bars will probably be within a trading range. Furthermore, the chart is close to an area where it has reversed up several times this year. The odds favor small trading range trading today.
While it is possible that this will be the breakout attempt that finally succeeds, it is more likely to do what all the others up and down has down. Hence, the odds are that it will begin to go sideways over the next week and then bounce. The bulls will try to create a double bottom with the October 25 low.
If the next few days are small days and do not break strongly below, the odds are that the chart will test up to the November 8 low around 1.1000. That was the breakout point for yesterday’s big reversal down. In a trading range, markets usually go back above resistance. If the bears fail to get their breakout, then traders will bet on a continued trading range and buy.
Summary of today’s S&P Emini futures price action and what to expect tomorrow
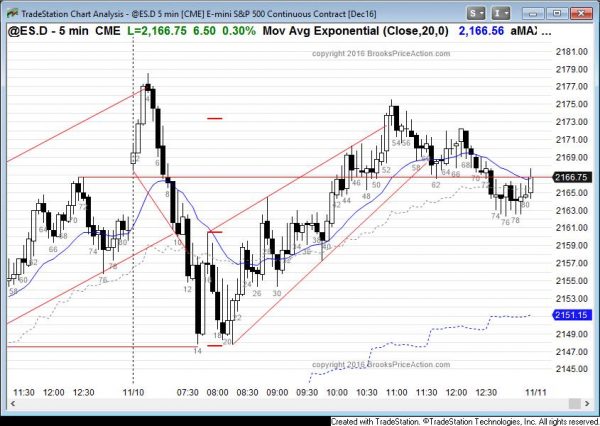
The Emini sold off from a bull breakout above a bull channel, about 6 points below the all-time high. While the selloff was strong, the bulls reversed the Emini up on a test of the bottom of yesterday’s bull channel. Today’s bottom was a parabolic wedge and then a double bottom. While the rally persisted for hours, it failed to get above the high of the open.
Tomorrow is a Friday and the week was strong. The bulls will try to close the week at a new all-time high. The bears want the rally to reverse down and form a double top with the August all-time high. The momentum up is strong and the odds favor a new all-time high.
See the weekly update for a discussion of the price action on the weekly candlestick chart and for what to expect going into next week.
Traders can see the end of the day bar-by-bar price action report by signing up for free at BrooksPriceAction.com. I talk about the detailed S&P Emini futures price action real-time throughout the day in the BrooksPriceAction.com trading room. We offer a 2 day free trial.
When I mention time, it is USA Pacific Standard Time (the Emini day session opens at 6:30 am PST, and closes at 1:15 pm PST). You can read background information on the intraday market reports on the Intraday Market Update page.


