Posted 6:55 a.m.
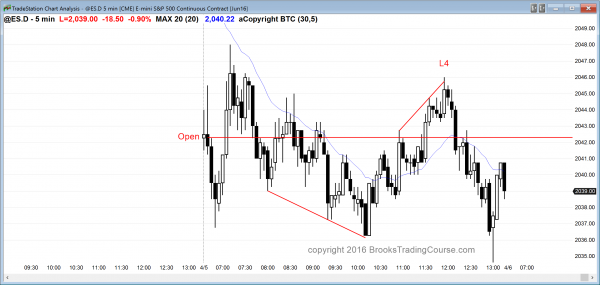
The Emini opened with a big gap down, and it sold off on the open. When there is a big gap down and an early selloff, the selloff usually lasts about 5 – 10 bars and then the Emini goes sideways to up to the moving average over the next couple of hours. Then, the Emini decides between trend resumption down and trend reversal up for the 2nd half of the day. It sometimes stays mostly sideways for the rest of the day.
The Emini is Always In Short, but it is far below the moving average and the bars are not strongly bearish. Three of the 1st 4 bars were dojis. This is more common in a bear leg in a trading range than in a bear trend. This increases the chances of an early minor reversal and the formation of a 2 hour trading range. The bulls need either a good buy signal bar or a strong reversal. The bears need much stronger bear bars, or a double top or a wedge bear flag, probably closer to the moving average. Until there is a strong breakout up or down, traders will be quick to take profits (scalp), and many will look for limit order entries. If there is a good stop order signal bar up or down, traders will take a swing, but probably will exit most or all at around 4 points for the 1st 2 hours.
Pre-Open Market Analysis
S&P 500 Emini: Learn how to trade evolving price action
The Emini has been in a 300 point trading range for 2 years and it is again near the top. Within that trading range, there have been 4 100 point tall trading ranges. I have been writing for the past several weeks that the rally since the March 1 bull breakout was likely the start of the next trading range. I have been saying this because of my 80% rule. Eighty percent of all attempts to break out of a trading range fail, no matter how strong the rally or selloff. I have brought this up repeatedly, including at the top of the October rally and the bottom of the August and February selloffs. All trading ranges end. One of these breakout attempts will succeed. Until one does, the odds are that each of them will fail. When the Emini is near the top, the math gets better for the bears. When it is near the bottom, the math is better for the bulls. We are near the top. The combination of probability, risk, and reward is better for the bears.
I said 3 weeks ago that the weekly chart would probably have a bear close after 6 bull trend bars. I also said that the odds favored 2 – 3 more weeks up and then a trading range was likely because that is what usually happens after the 1st pullback in a buy climax, especially at the top of a trading range.
I also said that the March 24 break below the tight bull channel on the daily chart was an early warning that the channel was probably beginning to evolve into a trading range. Bear who sold the next 2 breakouts to new highs made money. When bears begin to make money selling breakouts to new highs, a channel is beginning to convert into a trading range.
It is impossible to know if last week’s failed breakout above the December 29 lower high was the top of the trading range, or if there will be one or two more minor new highs. However, traders are beginning to sell. Look at the daily chart. There were only 2 bear bars in the 1st 22 days of March. There have been 5 in the past 8 days. The bears are getting stronger and the bulls are getting weaker. In a trading range, they are about equally strong and alternate control every few days. This is what appears to be happening.
There is still a 30% chance of a successful breakout above the July all-time high. This means that there is a 70% chance of there not being one. Either there will be no breakout or the breakout will soon fail, and the trading range will continue.
If the Emini is entering a trading range, the range will probably be similar to the past 4. Each lasted at least a month and had a height of about 100 points. If this one is similar, a 100 point pullback would tests the March 10 low and the February 1 neck line of the January/February double bottom.
The Emini is down 17 points in the Globex market. Yesterday was an ioi sell signal on the daily chart. Today will probably gap down and trigger that sell signal. However, one of the hallmarks of a trading range is disappointment. The bears might again be disappointed by what follows the gap down, like they were after Friday’s gap down reversed up into a huge bull trend day.
About 25% of big gaps become trend from the open bear trends. About 25% reverse up and become trend from the open bull trends. Fifty percent go up or down for 5 – 10 bars and then enter a trading range for a couple of hours. Once the Emini gets near the moving average, bulls will look for a double or wedge bottom and a trend reversal up. Bears will look for a double or wedge top and trend resumption down.
The daily chart has a small wedge top (March 22 and 30, and April 1). The bottom of the wedge is the March 24 low of 2012.25. That and the moving average are the 1st targets of a selloff, if one is beginning.
The bears see the March rally as forming a double top with the December 29 lower high. They want a breakout below the neck line, which is the February low, and then a 300 point measured move down to test the double top on the monthly chart. The bulls want a breakout above the other 2 lower highs in the October to December trading range and then a breakout to a new high and a 300 point measured move up. One or the other probably will happen. The bear case is more likely. Most likely over the next month, there will be another 100 point trading range, and then the 2 year trading range will continue indefinitely, as it has been doing.
Forex: Best trading strategies

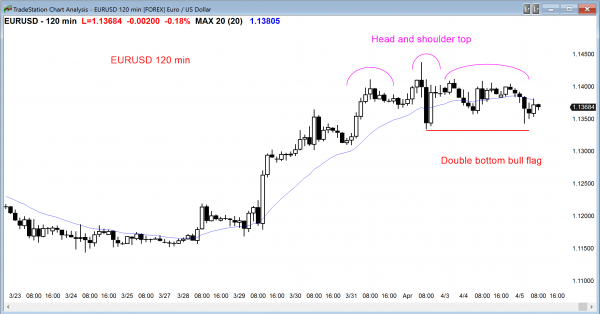
The EURUSD is in a nested wedge top on the daily and weekly charts near the top of a 2 year trading range. As strong as last week’s rally was, the past 3 days have been dojis, which is a sign of a balanced markets. The bulls are weakening just below the October major lower high around 1.150. They might still get their bull breakout, but the nested wedge tops increase the chances of a TBTL Ten Bar Two leg correction on the daily chart. This means a couple of weeks of sideways to down trading.
However, as long as the EURUSD holds above the March 17 high, there is a possibility of a measuring gap, and a probability that there will be at least a small bull breakout within a week. I showed that gap on yesterday’s chart. If the bulls get a strong breakout above this 3 day bull flag, the measured move up would be about 30 – 40 pips above that March 17 high.
Whenever there is a trading range in a bull trend, like there is on the 60 minute chart, the EURUSD is also in a bear trend. The bears see a head and shoulders top, and if there is a bear breakout, everyone will see that the bear trend began with the March 1 reversal down.
The bulls see a double bottom bull flag. If there is a bull breakout, traders will see the trend beginning with the March 1 strong bull reversal. The more bars that get added to a trading range, the more the probability falls to 50-50. The bulls still have a higher probability, but their advantage at this point is now maybe 55%. If the trading range continues for about 10 – 20 bars on the daily chart, the bulls will have lost their entire edge, and the bears will have the same chance of success.
The EURUSD has been in a 30 pip range overnight. This means that day traders are mostly scalping, and many are entering with limit orders and scaling in. This is common for Forex day traders. Everyone wants a strong breakout with follow-through because traders then quickly make a lot of money. However, 90% of the bars on any chart are either in a trading range or in a channel, and only 10% are in a strong breakout. The result is that trading profitably requires a lot of decisions and trade management most of the time.
Summary of today’s S&P Emini futures price action and what to expect tomorrow
The Emini gapped down and formed a small trading range day.
After a gap down and a brief rally, the Emini went sideways. Today is the entry bar for the bears who saw yesterday as a sell signal bar on the daily chart. The Emini might be converting from a bull channel into a trading range for the next month, but the bears need more selling before this becomes clear.
See the weekly update for a discussion of the price action on the weekly candlestick chart and for what to expect going into next week.
Traders can see the end of the day bar-by-bar price action report by signing up for free at BrooksPriceAction.com. I talk about the detailed S&P Emini futures price action real-time throughout the day in the BrooksPriceAction.com trading room, and a 2 day free trial is available.
When I mention time, it is USA Pacific Standard Time (the Emini day session opens at 6:30 am PST, and closes at 1:15 pm PST). You can read background information on the intraday market reports on the Intraday Market Update page.


