Posted 6:52 a.m.
The Emini opened with a big gap down just below the open of the week, which will probably be a magnet all day. Two of the 1st 3 bars had bull bodies. A big gap usually limits the movement for the 1st hour or two, and this early trading range price action is consistent with an early trading range. Once the Emini gets closer to the moving average after the 1st 2 hours, it decides whether it will resume down, reverse up, or stay sideways. This will probably be a limit order market for 1 – 2 hours. If there is a strong reversal up, traders will swing trade their longs. A big selloff is unlikely with a big gap down followed by bull bars on the open. However, the Emini often will sell off for 5 bars or so, and then enter its trading range.
Pre-Open Market Analysis
S&P 500 Emini: Learn how to trade developing price action reversals
The Emini rallied yesterday after falling below the low of the day before. When it fell below Wednesday’s low, it triggered a sell signal because it fell below a micro double top. That was a failed breakout to a new all-time high. However, Wednesday had a bull body, which is a low probability sell signal bar. The daily chart is in a tight bull channel and it had only 1 bear body in the 11 days since the May 24 bull breakout. That is not enough selling pressure to make a swing down likely. Finally, yesterday was the entry bar and it was a bull reversal bar, not a big bear trend bar. The market might ignore the sell signal.
The cash index came to within 14 points of its all-time high on Wednesday, and yesterday’s reversal down was weak. The odds are that the cash index will test closer to its all-time high. If the cash index rallies 14 points above Wednesday’s high, so will the Emini. Since Wednesday’s high was around 2111, there is then a magnet pulling it up to around 2125.
The 60 minute chart is trying to form a lower high major trend reversal this week. However, if the Emini instead rallies to a new high, the bears will then try to form an expanding triangle top. The Emini has been in an 80 point trading range for 3 months. The bulls want a measured move up. The bears want a test back down to the bottom of the range, which is also 80 – 100 points away.
Most trading range breakouts fail to go very far so the odds are that this one will be like most others. That does not mean that the bears will get their 100 point selloff, but the math is good for the bears here. If they are able to begin to create bear bars on the daily chart, that selling pressure will tell traders that the bears are getting strong. They then will look for a top to sell. Some will wait for a higher probability sell, which means they will wait until there is a strong bear breakout.
In the meantime, the momentum bulls are still in control, betting that the Emini will continue to make new highs. The bears hope that the developing 60 minute Head and Shoulders Top or Expanding Triangle top will be the start of several weeks down. However, before the overnight selloff in the Emini, the odds favored higher prices until there was more selling pressure or a strong bear reversal.
The Emini is down 13 points in the Globex session, falling from yesterday’s 60 minute lower high major trend reversal. The next target is the June 3 low of 2073.75, which is the bottom of a 3 week trading range that might be the final bull flag on the daily chart. If the Emini gets there and bounces, it would create a possible small head and shoulders top on the daily chart. A strong break below there would make traders look at a possible 50% pullback of the May rally, or even a test of the April low. I have been writing for over a week that there is a 60% chance of a test of the April low before an equal move up. It is too early to know if today is the start of the move down.
Today is a Friday so weekly support and resistance can be magnets, especially late in the day. The open of the week is 2092.25. The bears want a bear reversal bar for a failed breakout to a new all-time high. This would create a small sell signal bar for next week.
Forex: Best trading strategies
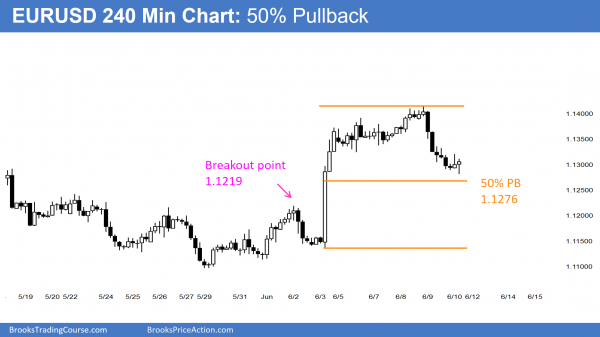
The EURUSD Forex 240 minute chart sold off for the past 2 days to close to a 50% pullback of the 2 week rally, and will try to bounce soon.
The EURUSD daily chart had an outside down day yesterday, triggering a lower high major trend reversal. However, the lower high is in a 5 month trading range and the rally last week was only a single bar. That is usually not enough for a major reversal. The reversal is more likely to be minor, which means that the bear leg that started yesterday will probably only be a bear leg in the trading range and not the start of a swing down.
I have been writing for weeks that the selloff from the May 3 high would probably test the March 16 low. That is because that is what usually happens when a Spike and Channel rally reverses. As it got down to near the March 16 low, I wrote repeatedly that the odds favored a trading range and that the EURUSD chart would probably have about a 50% retracement of the April selloff and test to the 1.1350 area, and then pull back. Yesterday was part of that pullback.
Since last week’s rally was so strong, and the selloff that preceded it was also strong, there is a Big Down, Big Up pattern. When that happens, traders (the market) is confused. When there is confusion, bulls and bears believe rallies and selloffs will not go to far. The start to buy low, sell high, and take quick profits. This creates a trading range, and that is what is likely for the next several days.
While it is possible that yesterday was the start of a bear trend, or that last Friday was the start of a bull trend, it is more likely that both are just legs within the 2 month trading range that began on March 16, and the larger range that began in March 2015.
The EURUSD Forex chart was in a trading range overnight, and it got close to the 50% pullback of the rally that began on June 3. Th exact price is 1.1276, which is 5 pips below the overnight low. I have been writing for the past week that a trading range lasting about a week was likely. This selloff is searching for the bottom of the range, and that bottom will probably be close to where the EURUSD is now. The 60 minute bear channel of the past 2 days is tight, and the EURUSD will probably have to go sideways to form a small base before it can bounce. The odds are that it will be in a trading range today as it tries to form that base.
Summary of today’s S&P Emini futures price action and what to expect tomorrow
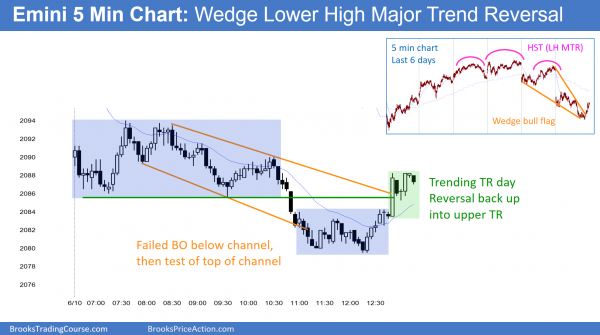
The Emini gapped down and sold off in a trending trading range day. It reversed back up into the upper range at the end of the day, which happens 60% of the time. After the bear break below the bear channel, it reversed up to the top of the channel, which happens 75% of the time.
I have been writing over the past couple of weeks that the Emini would probably fall 80 – 100 points over the next month or so. Today might be the start of the selloff. The weekly chart has a bear reversal bar, but the rally at the end of the day put a tail on the bottom of the bar. This weakens it and increases the chances of another leg up. The bears need follow-through selling early next week. The bulls want this bear reversal to fail and for the cash index to continue up to its all-time high.
See the weekly update for a discussion of the price action on the weekly candlestick chart and for what to expect going into next week.
Traders can see the end of the day bar-by-bar price action report by signing up for free at BrooksPriceAction.com. I talk about the detailed S&P Emini futures price action real-time throughout the day in the BrooksPriceAction.com trading room, and a 2 day free trial is available.
When I mention time, it is USA Pacific Standard Time (the Emini day session opens at 6:30 am PST, and closes at 1:15 pm PST). You can read background information on the intraday market reports on the Intraday Market Update page.


