Posted 6:54 a.m.
Friday was a sell climax. Today had a 75% chance of at least a couple of hours of sideways to up trading beginning by the end of the 2nd hour. It might have begun at the end of Friday.
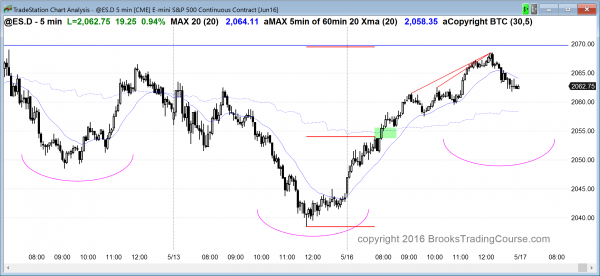
The Emini began with a series of bull trend bars that rallied above the breakout point in Friday’s selloff (the 7:45 a.m. low). It is Always In Long. The rally is strong enough so that the 1st pullback will probably be bought. However, there have been several strong rallies over the past couple of weeks that reversed to a measured move down. The odds are against that, but because of the recent history, the bears might begin the process and create a deep pullback. The odds are that the best they get is a trading range day, but if it becomes a small pullback bear trend day, day traders will sell and not question it.
Because the bull bars are not especially big, this might end up as a trading range day. The odds are that the rally was strong enough so that the day will either be a weak bull trend that tests the 60 minute moving average, or mostly a trading range day. The odds are against a big bear trend day, especially since the daily chart is at the bottom of its trading range.
Pre-Open Market Analysis
S&P 500 Emini: Day trading candlestick patterns at bottom of trading range
The daily chart is forming a small Head and Shoulder top (lower high major trend reversal). However, 60% of tops fail. With with bulls so strong on the weekly chart and with this pattern being so small on the daily chart, the odds of a big reversal down (a major reversal down) from this top are less than 40%.
More likely, the trading range will continue. Also, the weekly chart had an 11 week bull micro channel. There has been a 3 week pullback. Most pullbacks from micro channels that last 10 or more bars end in 1 – 3 weeks and are followed by a test of the top of the micro channel. That is what is most likely here over the next 2 weeks.
If instead the bears get a strong bear breakout below the neck line of the top, the odds of follow-through selling go up. With the weekly rally from the February low being as strong as it was, the odds of a bear trend reversal are less than 40%. The Emini could obviously sell off for weeks, but if it does, there will probably be buyers at around a 50% pullback.
Most tops are in trading ranges, and all trading ranges have both reasonable buy and sell setups. The bulls see the trading range of the past month as a triangle bull flag. The see the 3 last days as a bull flag on the 60 minute chart. In general, once a trading range in a bull trend has grown to 20 or more bars, the odds of a bull breakout fall to around the same as the odds for a bear breakout (50%). Also, there is a 50% chance that the 1st breakout up or down will fail and reverse.
What does all of this mean? It means that more bars getting added to the trading range is more likely than a successful breakout. In a trading range, a trader has a better chance of making money if he buys low, sells high, and scalps (bets that any move will be limited). The Emini is around the bottom of the trading range, which is the buy zone. The odds favor a bounce of at least a couple of days this week.
The Globex chart is up 2 points and it has been in a tight trading range overnight. The big swings on the 5 minute chart of the past couple of weeks will probably soon be replaced by trading range price action.
Forex: Best trading strategies
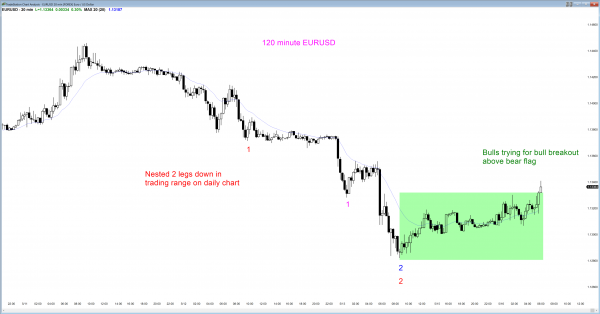
Possible bull breakout above bear flag late in a bear trend on the EURUSD 20 minute chart (I meant to use a different time frame, but this chart still illustrates the point).
The EURUSD had a big bear breakout on Friday below an attempted bull flag on the daily chart. The breakout was strong enough so that the 1st reversal up will likely be sold and be followed by at least one more test down. However, the selloff is still in a trading range and still above the April 25 strong bull reversal. There is about a 50% chance that Friday’s bear breakout will fail, even if there is 1st another one or two days down.
Although at least a small 2nd leg sideways to down is likely, and although last week was an entry bar on the weekly chart after a wedge top, the odds are that the best the bears will get over the next week is a trading range. The bear breakout on Friday was decent, but not strong enough to convince most traders that it is the start of a swing down.
If the bears get strong follow-through selling, traders will not deny it. They will sell. It is more likely that traders will conclude that the selling has not been very strong, and the 3 week selloff is probably getting near its end. The odds favor a bounce early this week and the at least a trading range. The EURUSD has rallied about 50 pips above Friday’s low. The rally on the 60 minute chart has lacked consecutive big bull trend bars. Many of the bars overlap, and there are many bear bars. This rally is a bear flag on the 60 minute chart. However, a bear flag in a weak selloff that is holding above the low of a strong rally (the April 24 low) has about a 50% chance of being followed by a bull breakout, and a 50% chance of a bear breakout. If there is a bear breakout, there is at least a 50% chance that it will fail, and this bear flag will be the Final Flag of the 2 week selloff from the May 3 high.
A Final Flag does not mean the start of a bull trend. Its minimum goal is an end of the bear trend on the 60 minute chart. The daily chart entered an 8 bar tight trading range on April 1. That is an area of intense agreement. The bulls tried to get a bull breakout and failed. The bears are trying to get a bear breakout. More likely, the daily chart will again go sideways for several days at this price level.
Summary of today’s S&P Emini futures price action and what to expect tomorrow
Today was a small pullback bull trend day.
The odds favored a rally today or this week. There has been a 3 bar pullback on the weekly chart after an 11 bar micro channel. Usually the pullback lasts 1 – 3 weeks so the Emini is at the outer window and due to bounce.
The daily chart formed a head and shoulders top but the pattern did not have many bars. Since tops usually fail and this is a small one, the odds favored a reversal up.
The 60 minute chart turned up from a higher low major trend reversal (head and shoulders bottom). Although today’s rally is still below the neckline, which is the May 2 and 10 double top, the reversal up today was strong enough so that the 1st reversal down will probably be bought. The odds are that the Emini will get back to the 2080 area this week.
If there is a pullback tomorrow, it might form a nested Head and Shoulders bull flag. A nested pattern is one where the 3 leg subdivides into a smaller version. The May 12 low might be the left shoulder of the nested pattern.
While it is possible that tomorrow could reverse down and lead to a breakout below the April low, higher prices are more likely over the next few days.
Because today was a small pullback bull trend, it was a buy climax. Tomorrow has only a 25% chance of being a strong bull trend day, although there is a 50% chance of follow-through buying in the 1st 2 hours. There is a 75% chance of at least 2 hours of sideways to down trading that starts by the end of the end hour, and it might have already begun.
See the weekly update for a discussion of the price action on the weekly candlestick chart and for what to expect going into next week.
Traders can see the end of the day bar-by-bar price action report by signing up for free at BrooksPriceAction.com. I talk about the detailed S&P Emini futures price action real-time throughout the day in the BrooksPriceAction.com trading room, and a 2 day free trial is available.
When I mention time, it is USA Pacific Standard Time (the Emini day session opens at 6:30 am PST, and closes at 1:15 pm PST). You can read background information on the intraday market reports on the Intraday Market Update page.


