Failed bear breakout, but October selloff still possible
Updated 6:45 a.m.
The Emini opened with a big gap down. Yet, the 1st bar was a doji and the 2nd and 3rd bars had tails below. Therefore there is no sense of urgency. Traders feel that the price is about right. This increases the chances of a trading range for the 1st hour or two. The bulls will look for a strong reversal up or a double or wedge bottom. They need a strong breakout above the moving average if they are to create a bull trend day. The bears will look to sell a double top or wedge top near the moving average.
The Emini is Always In Short and is in a sell vacuum down to the September low. The bulls bought there last month and might again today. The bears need a strong breakout below. If they get it, the Emini will probably trade below the July 2015 high within a week.
Pre-Open Market Analysis
The Emini has rallied for a day and a half after Monday’s selloff. Hence, this is bad follow-through from that selloff. It therefore increases the chances that the month-long trading range will continue.
As a result, nothing has changed in 2 months. The bears still believe that there will be a brief 100 point selloff from the August 15 and 23 tight trading range double top. In addition, the bulls believe that the bears will give up. Hence, they want a bull breakout above this month-long bear flag. Furthermore, they want a measured move up, which would result in a new all-time high.
Because the trading range on the daily chart has lasted about 20 bars, the probability for the bulls and bears is now 50%. Traders will continue to take quick profits until there is a strong breakout with follow-through.
Emini Globex session
The Emini is down 13 points in the Globex session. If it opens here, it will gap below yesterday’s low. Yesterday was an inside bar on the daily chart after a bear breakout. Hence, it was a sell signal bar. A gap down would trigger the sell signal.
The 1st target is the September low. That low was a test of the July 2015 trading range high, and therefore a breakout test. The bulls will therefore again try to defend the gap if the Emini gets there. Yet, a gap this late in a bull trend has a 70% chance of closing before the rally can get far. Therefore, it is more likely that a test of the September low would fail. As a result, the Emini would probably continue below the 2084 top of the 2 year trading range.
Because the selloff has lacked consecutive big bear bars closing on their lows, the bears still only have about a 50% chance of achieving their goal during the current 3 day selloff. Yet, with so many bulls believing that the gap will stay open and the Emini will continue up to a new high, a single big bear bar could change their minds.
As a result, all of the bulls who bought since July would suddenly be holding losing positions in a quickly falling market. They would quickly sell, adding the to bear breakout. This therefore has the potential to lead to a sudden, big move down. One target is the July 6 low, which was the 1st pullback from the bull rally.
Forex: Best trading strategies
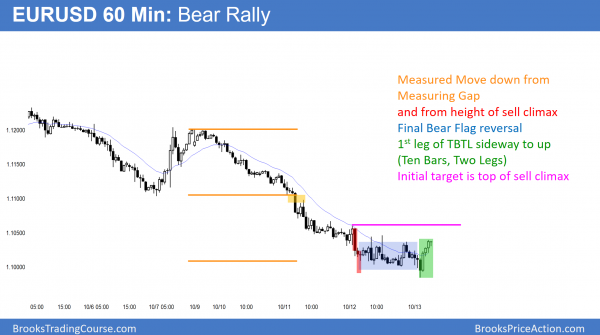
The 60 minute EURUSD chart had a sell climax in an oversold bear trend. It reversed up overnight from 2 measured move targets. The odds are that it will have at least 10 bars and 2 legs sideways to up to the top of the sell climax.
The 60 minute EURUSD chart has fallen for over 100 bars without much of a correction. That is extreme and therefore a sell climax. There was a big bar yesterday, and hence and extreme final sell climax. When that happens, the EURUSD market often has a small, brief 2nd leg down that is about the height of the bod of that sell climax bar. Last night’s reversal was also at a measured move projection from the breakout 2 days ago. Therefore, traders expect Ten Bars, Two Legs sideways to up to the top of the sell climax as the minimum goal of the bear rally. While the 5 minute chart has a wedge top, bulls will probably buy the reversal down.
Summary of today’s S&P Emini futures price action and what to expect tomorrow
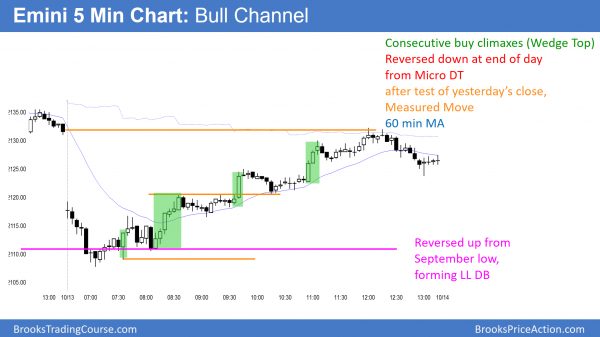
The Emini gapped down and reversed up from the September low. After a series of buy climaxes, it failed to hold above yesterday’s close.
While the Emini reversed up on the daily chart and formed a buy signal bar for tomorrow, the late selloff created a tail on the top of today’s bar. Hence, it is a weaker buy signal bar. Despite the bull reversal, the odds still slightly favor a test below the July 2015 low before a new high.
See the weekly update for a discussion of the price action on the weekly candlestick chart and for what to expect going into next week.
Traders can see the end of the day bar-by-bar price action report by signing up for free at BrooksPriceAction.com. I talk about the detailed S&P Emini futures price action real-time throughout the day in the BrooksPriceAction.com trading room. We offer a 2 day free trial.
When I mention time, it is USA Pacific Standard Time (the Emini day session opens at 6:30 am PST, and closes at 1:15 pm PST). You can read background information on the intraday market reports on the Intraday Market Update page.


