End of quarter window dressing before 5% correction
Updated 6:51 a.m.
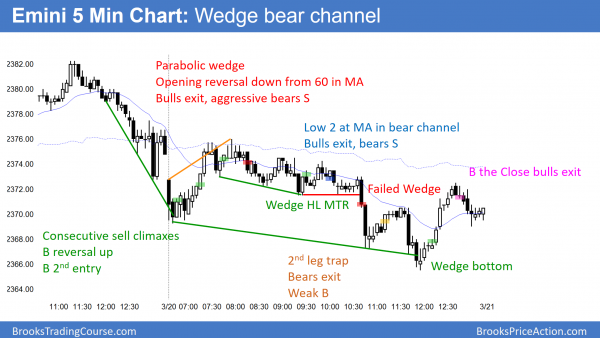
The open continued Friday’s parabolic sell climax. Yet, most sell climaxes evolve into trading ranges. Therefore the odds are that the downside will be limited over the 1st hour or two. There is a 60 minute bull trend line and a leg 1 = leg 2 measured move target a few points below the initial low. Hence, the Emini might work lower over the 1st 2 hours.
While it is possible that the test down to the December close has begun, it is more likely that the 3 day selloff is just a leg in a tight trading range on the daily chart. In addition, because the selling since late Friday is climactic, the odds favor a reversal up within the 1st 2 hours.
Since the selloff has been in a tight bear channel, the 1st rally will probably be a bull leg in a trading range. The bulls will therefore probably need a major trend reversal before they can create a bull trend. Hence, since the upside and downside will probably not be great, the odds are that the Emini will be in a trading range for a couple of hours this morning.
Pre-Open market analysis
Because the weekly chart’s high is extremely far above the moving average, the odds are that the Emini will sell off to that average. While the daily and weekly charts are in strong bull trends, traders will probably sell rallies. They expect that the buy climax will reverse down from the measured move targets around 2400. The 2 year Final Bull Flag on the monthly chart created those targets.
Because the daily chart is in a bull trend, the trend could continue without a pullback. Yet, the extreme buy climax on the weekly chart makes that unlikely.
Trader’s equation for a sell signal
The Emini has been in a tight trading range for 3 weeks. Since it is stalling after a buy climax at major resistance, traders will look for sell patterns. If they see a double top or wedge top within the tight trading range, and there is a good sell signal bar, they will sell. The probability of a good top leading to a major reversal is only 40%. Yet, because the reward is much bigger than the risk, the Trader’s Equation is positive.
Traders who prefer high probability trades will not sell until they see a strong bear breakout. The price they pay for high probability is worse risk/reward. The stop is further away and there is less profit remaining. Yet, the math is still good.
Overnight Emini Globex trading
The Emini is down 4 points in the Globex market after Friday’s failed breakout above a bull flag on the 60 minute chart. The odds favor either a continuation of the 2 day trading range, or one more leg down from last week’s buy climax high.
Although the 5 day rally is a lower high, it is only a 5 day rally. Hence, it is too small to have much chance of leading to a major trend reversal down. Hence, the best the bears can probably get over the next week is a continuation of the 3 week trading range.
Since the high on the weekly chart is extremely far above the moving average, the best the bulls can probably get, before a pullback to the weekly moving average, is a week or two of additional trading range.
Hence, the trading range on the daily chart will probably continue for at least another week. Therefore, most days will probably be mostly trading range days. The March 9 low is the current low of the range. There are probably buyers below that low. In addition, bulls will probably buy above the low to try to create a higher low.
EURUSD Forex market trading strategies
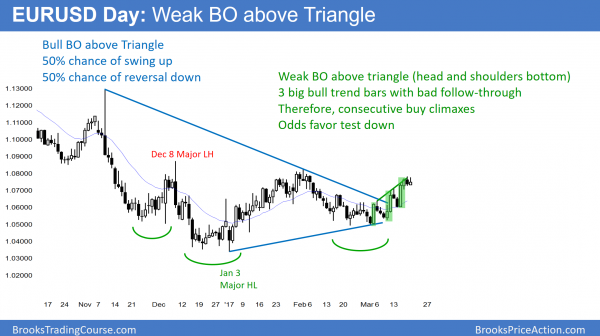
The EURUSD daily Forex chart has had 3 strong rallies over the past 3 weeks after breaking above a triangle. Yet, each buy climax had bad follow-through.
The EURUSD daily Forex chart has rallied for 3 weeks. Yet, the rally has 3 big bull breakouts and therefore 3 consecutive buy climaxes. Each led to bad follow-through. This is a type of wedge rally and therefore the odds favor a pullback or a reversal down.
Because the daily chart is reversing up from the bottom of a 2 year trading range and from a head and shoulders bottom, the odds are that it will work higher over the next several weeks. Yet, without a strong breakout above the November 9 and December 8 major lower highs, the rally will either be a bear flag or a bull leg in a trading range. Furthermore, without a breakout below the January 3 low, the bears only have a trading range, and not a bear trend.
Hence, the daily and weekly charts are in breakout mode. Traders therefore need more information, which means more bars, before they will have a strong opinion of the direction of the next major move.
Because the 3 week rally has had 3 buy climaxes and deep pullbacks, it is a type of wedge rally. Hence, the odds favor a pullback over the next several days. Yet, the rally might continue a little more before the pullback begins.
Overnight EURUSD Forex trading
The EURUSD Forex market has been in a 40 pip tall trading range for 2 days. The 60 minute chart has a head and shoulders top. While the odds favor a downside breakout and a test of the March 6 high, the bulls might get one more minor high first. Less likely, the bulls will get a strong breakout above this wedge top and then a measured move up to above the December 8 high.
Summary of today’s S&P Emini futures price action and what to expect tomorrow
The Emini sold of from an Opening Reversal down from the 60 minute moving average. It then reversed up from a wedge bottom and formed a trending trading range day.
This was the 3rd day down from a lower high on the daily chart. But, it is probably just a bear leg in a trading range. The odds are that it will begin a test of last week’s high within a day or two. The top does not have enough bars to be a major top. Therefore, a continued trading range is more likely than a bear trend.
See the weekly update for a discussion of the price action on the weekly candlestick chart and for what to expect going into next week.
Traders can see the end of the day bar-by-bar price action report by signing up for free at BrooksPriceAction.com. I talk about the detailed S&P Emini futures price action real-time throughout the day in the BrooksPriceAction.com trading room. We offer a 2 day free trial.
When I mention time, it is USA Pacific Standard Time (the Emini day session opens at 6:30 am PST, and closes at 1:15 pm PST). You can read background information on the intraday market reports on the Intraday Market Update page.


