Emini wedge rally before Senate Trump tax cut vote
Updated 6:50 a.m.
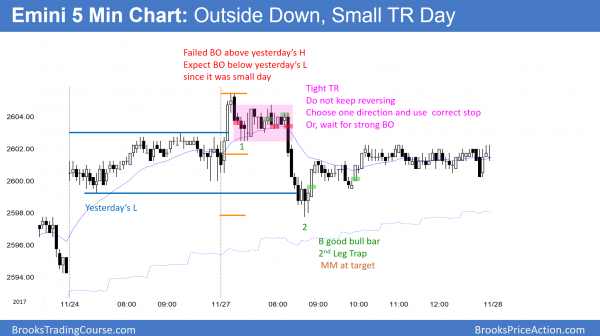
Today gapped up to a new all-time high, but the 1st bar was a small doji. The past 3 days were small trading range days. Today’s 1st bar increases the chances for today to be another small trading range day.
The 4th bar was a sell signal for a 2nd failed breakout above yesterday’s high. However, this is an early tight trading range. Therefore, the Emini will more likely go sideways more before deciding on its initial swing. At the moment, the Emini is Always In Short. Yet, the math is better to wait for a stronger setup or a strong breakout up or down.
While yesterday was an outside day, it was not big. Therefore a reversal down from above yesterday’s high could create a 2nd outside day.
Pre-Open market analysis
By trading below Friday’s low, yesterday triggered a sell signal on the daily chart. Yet, as a doji, it was a weak sell signal bar. In addition, yesterday was a small outside day, not a big bear day. It was therefore not a strong sell entry bar for the bears. Consequently, the daily chart will probably be mostly sideways again today.
The weekly chart had a bull bar last week after a 4 bar tight trading range. Three of those bars were dojis, which means a one bar reversal. This increases the odds that last week will be the 1st half of a 2 bar reversal. That means that there is an increased chance that this week will sell off and be a bear trend bar on the weekly chart.
Until the daily chart has consecutive big bear days, the odds are that every reversal will fail. Yet, the buy climaxes on the daily, weekly, and monthly charts have never been this extreme. Consequently, the odds favor a 5% pullback starting soon.
Overnight Emini Globex trading
The Emini is up 3 point in the Globex market. Since the sell signal bar Friday and the sell entry bar yesterday were both weak, traders do not yet believe that the top is reliable. Until the bears get at least 2 big consecutive bear days, the bulls will buy every reversal attempt. Consequently, the odds continue to favor higher prices.
The 2 week rally has been much weaker than all of the prior breakouts this year. In addition, the buy climaxes on the daily, weekly, and monthly charts have never been this extreme. Therefore, there is an increased risk of a big bear day coming at any point.
Even though the bull trend has been very strong, this 2 week rally has been week. That makes a big bull trend day less likely over the next few days. However, extreme buy climaxes sometimes end with dramatic, huge bull trend days. Therefore, traders should be ready for a surprisingly big day up or down. If there is a huge day, down is more likely. Since the past 3 days have been small, today will most likely be another trading range day.
Yesterday’s setups
Here are several reasonable stop entry setups from yesterday. I sometimes also show limit order entries and entries on the close of bars.
EURUSD Forex market trading strategies
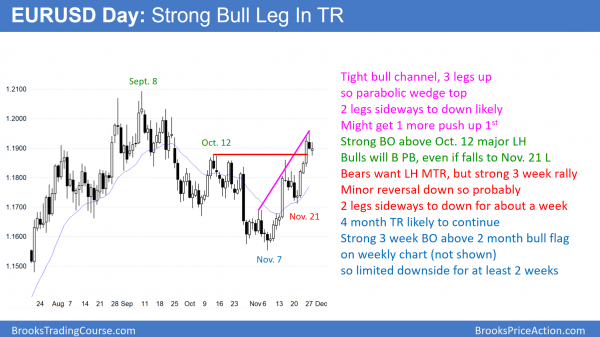
The EURUSD daily Forex chart has rallied strongly for 3 weeks. The rally is within a 4 month trading range. Since it has 3 legs and it is in a tight bull channel, it is a parabolic wedge buy climax.
The 3 week rally on the EURUSD daily chart has been strong. Because it is in a parabolic wedge, the odds are that the bulls will soon be exhausted. Consequently, the daily chart will probably go sideways to down for about a week before the bulls try again to break above the 2 year high. Because the rally has been very strong, the bulls might get one more brief new high this week before the pullback begins.
While a parabolic wedge rally can lead to a major trend reversal, it rarely will do so immediately. The bears usually need at least a micro double top, or an endless pullback. An endless pullback is a tight trading range that is sloped down slightly. Initially, it is a bull flag. However, if it grows to 10 or more bars, the odds of a bear breakout below the bull flag reach 40% or more.
This means that there is little downside risk for at least another week. Furthermore, the strong rally is still within a 4 month trading range. Since trading ranges resist breaking out into trends, they have many strong legs up and down. So far, this is just another. It is more likely that the trading range will continue than it is that this is the start of a bull trend.
Overnight EURUSD Forex trading
The 5 minute chart has pulled back 90 pips from yesterday’s parabolic wedge top. This selloff is more likely a bull flag than a bear trend. Consequently, bulls will be looking for a strong bottom or a strong rally for a swing trade up. There is none yet. In addition, the 3 week buy climax will probably need at least another week of sideways to down trading before the bulls try to resume the rally. Therefore the odds favor several more sideways days. Traders will therefore mostly scalp.
If there is a strong breakout within the next week, up is more likely than down. However, even if there is a rally above last week’s high this week, it probably will soon pull back. This is because a parabolic wedge rally is made of a series of buy climaxes. That is unsustainable. It therefore usually soon leads to at least 5 – 10 bars of sideways to down trading.
Summary of today’s S&P Emini futures price action and what to expect tomorrow
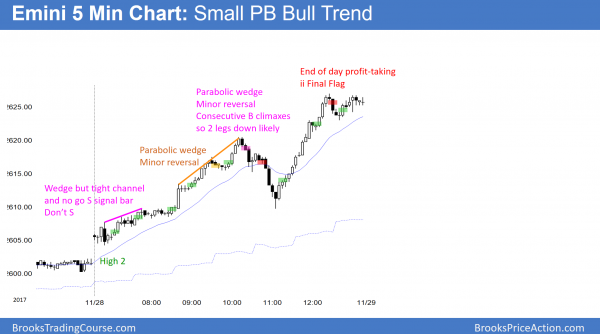
Today was a small pullback bull trend day. A parabolic wedge led to a strong selloff in the middle of the day, but the bulls bought it. It was a 2nd leg trap and a 50% pullback.
Today was an exceptional day for the bulls. It was a strong bull trend day and it broke far above the wedge top on the daily chart. The odds are that bulls will buy the 1st pullback.
The 5 minute chart had a climactic rally. Therefore the odds are that tomorrow will have at least a 2 hour trading range beginning by the end of the 2nd hour.
See the weekly update for a discussion of the price action on the weekly candlestick chart and for what to expect going into next week.
Traders can see the end of the day bar-by-bar price action report by signing up for free at BrooksPriceAction.com. I talk about the detailed S&P Emini futures price action real-time throughout the day in the BrooksPriceAction.com trading room. We offer a 2 day free trial.
When I mention time, it is USA Pacific Standard Time (the Emini day session opens at 6:30 am PST, and closes at 1:15 pm PST). You can read background information on the intraday market reports on the Intraday Market Update page.


