Trading Update: Monday October 11, 2021
Emini pre-open market analysis
Emini daily chart
- Friday triggered a weak Low 2 sell signal. With Friday closing near its low, there is an increased chance of at least slightly lower prices today.
- Bears want gap down today or this week so that there would be an island top after a 7-day island bottom. However, island tops and bottoms are usually minor patterns and do not lead to trends.
- Middle of month-long trading range between 50- and 100-day moving averages.
- Middle of 4-month trading range.
- Friday is also an Emini weak High 1 buy signal bar because it has a bear body and the Emini is in the middle of a trading range.
- September 23 is a major lower high and it is near 50-day MA. Both are magnets above.
- 50% chance that a 15% correction has begun.
- 50% chance of new high before there is a 15% correction.
- Two quiet days in middle of 4-month trading range reduces chance of big trend today.
- Trading range is Breakout Mode so big breakout can begin at any time.
Emini 5-minute chart and what to expect today
- Emini is down 5 points in the overnight Globex session so today might gap down.
- That would create a 2-day island top, but since it the Emini is in the middle of a month-long trading range, it has little predictive value.
- If today gaps down, the gap will probably be small. Small gaps typically close early in the day.
- There have been a lot of reversals for two days. That reduces the chance that today will be a big trend day in either direction.
- Traders should expect a test of the 50-day MA this week. Thursday’s high did not quite reach it. Therefore, there should be at least one bull trend day this week.
- However, the Emini might test the 100-day MA and the top of last week’s 4-day tight trading range at around 4,350 first.
Friday’s Emini setups

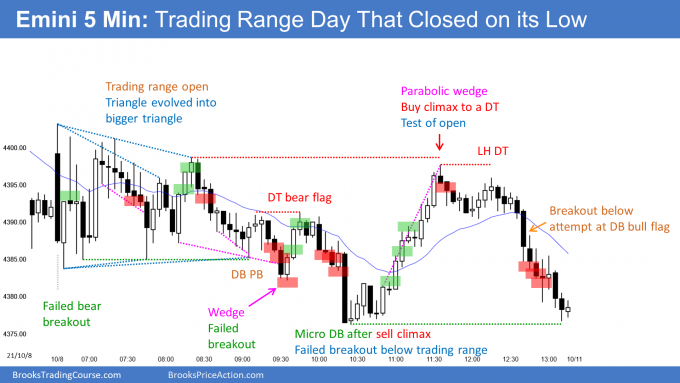
Here are several reasonable stop entry setups from Friday. I show each buy entry with a green rectangle and each sell entry with a red rectangle. Buyers of both the Brooks Trading Course and Encyclopedia of Chart Patterns have access to a much more detailed explanation of the swing trades for each day (see Online Course/BTC Daily Setups).
My goal with these charts is to present an Always In perspective. If a trader was trying to be Always In or nearly Always In a position all day, and he was not currently in the market, these entries would be logical times for him to enter. These therefore are swing entries.
It is important to understand that most swing setups do not lead to swing trades. As soon as traders are disappointed, many exit. Those who exit prefer to get out with a small profit (scalp), but often have to exit with a small loss.
If the risk is too big for your account, you should wait for trades with less risk or trade an alternative market like the Micro Emini.
EURUSD Forex market trading strategies
EURUSD Forex daily chart

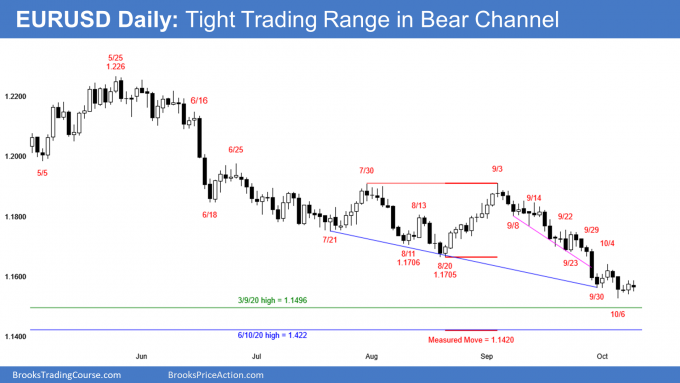
- 2 climactic legs down below August 20 low so might get profit taking.
- Tight trading range for 4 days in tight bear channel so small Breakout Mode pattern.
- Today so far is a small inside day and the 3rd consecutive small day. That reduces the chance of a big move up or down today.
- Bulls see micro double bottom and bears see micro double top (Thursday and Friday’s highs).
- Since tight bear channel since September 3 high has lasted more than 20 bars, and there are magnets below, 1st reversal up will likely be minor.
- Magnets below are March 9, 2020 high and June 10, 2020 high, which are breakout points in the strong 2020 rally.
- There is also a measured move target there, based on the July 30/September 3 double top.
- EURUSD is close enough to support for it to reverse up at any time.
- It is currently likely to dip below the March 9, 2020 high before there is a rally lasting several weeks to above the August 20 low and maybe to the September 3 high.
Summary of today’s S&P Emini futures price action and what to expect tomorrow

End of day summary
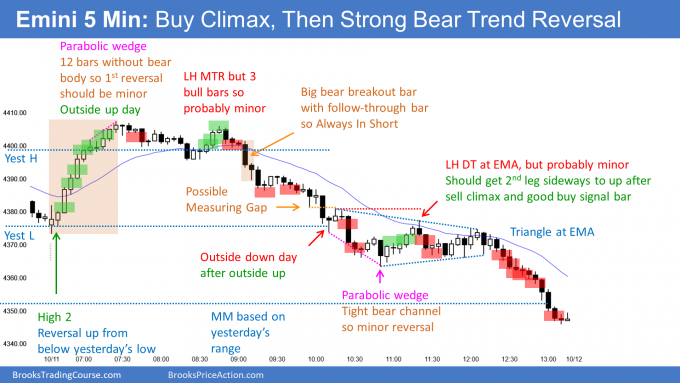
- Small gap down closed on 1st bar, then got streak of 12 bars without a bear body.
- Major Bull Surprise on bars 3, 4, 5, and 6. That made bear trend day unlikely (but today’s bear trend was big enough so that today became a bear trend day anyway).
- Early rally went above Friday’s high, making today an outside up day.
- Reversed down strongly from a lower high major trend reversal.
- Sold off to below yesterday’s low, becoming an outside down day after being an outside up day.
- Closed near the low of the day and closed the gap above Wednesday’s high.
Big sell climax day so 75% chance of at least a couple hours of sideways to up trading beginning by end of 2nd hour tomorrow. - Bears hope Thursday was a lower high double top on the daily chart with the September 28 high and that the 2-day selloff is a resumption of the bear trend that began with the September 2 high.
- 50% chance that a 15% correction began on September 2.
- Thursday’s high did not quite reach the 50-day MA, and traders might want to see a better test before they will be willing to sell aggressively again.
- In trading range since July. Traders are deciding if a 15% correction is underway or if the September selloff is just a pullback in the 18-month bull trend.
- With today closing near its low, there is increased chance tomorrow will gap down. That would create a 3-day island top.
- Next important magnet below is the open of the month. October or November should be a 2nd bear bar on the monthly chart.
See the weekly update for a discussion of the price action on the weekly chart and for what to expect going into next week.
Trading Room
Traders can see the end of the day bar-by-bar price action report by signing up for free at BrooksPriceAction.com. I talk about the detailed S&P Emini futures price action real-time throughout the day in the BrooksPriceAction.com trading room. We offer a 2 day free trial.
Charts use Pacific Time
When I mention time, it is USA Pacific Time. The Emini day session charts begin at 6:30 am PT and end at 1:15 pm PT which is 15 minutes after the NYSE closes. You can read background information on the market reports on the Market Update page.

