Posted 6:58 a.m.
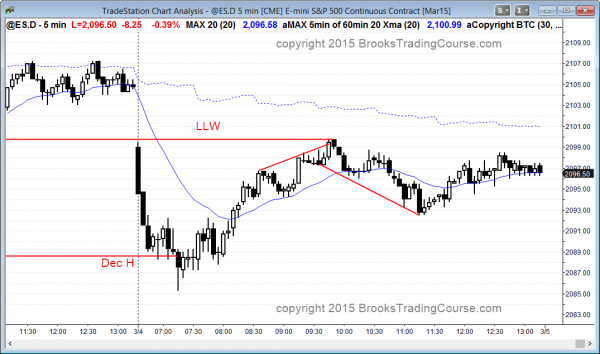
The Emini sold off strongly on the open and fell 2 ticks below the December high. Because this was a sell climax to support, there probably will be some profit taking and there is a chance of an endless pullback up that creates the low of the day.
Until the bulls create a series of strong bull trend bars or a major trend reversal, the probability is that today will be either a bear trend day or a trading range day. However, bulls bought the past 5 new lows on the 60 minute chart and will buy this one as well. Traders have to be open to the possibility that this is a sell vacuum test of support and the low of the day. At the moment, any rally is a rally within a trading range or a bear trend and bears will look to short. The most important target for the bulls is yesterday’s low, but that is currently far above the market and it probably will not be reached.
My thoughts before the open: Pullback can become a trend reversal
That series of 10 consecutive bull trend days to a new all-time high is a problem for the bulls. Whenever there is an exceptionally strong buy climax at a new high, there is a risk of a big trend reversal. However, the market usually goes sideways for 10 – 20 bars first. The bears have to create selling pressure before a reversal takes place.
The 60 minute chart is in a trading range after a strong rally. Every trading range has both bull and bear patterns within it because there is about a 50% chance of both trend resumption and trend reversal. So, what is the bear pattern? It is always a major trend reversal. In addition, the 60 minute chart is in the early stage of a bear channel, forming a series of subtle lower highs and lows. Traders learning how to trade the market know that a bear channel is a bull flag. However, if the bulls continue to be unable to breakout above lower highs in the trading range, at some point they sell out of their longs and wait. They want to see just how strong the bears are. If the bears are unable to reverse the market, the bulls will buy back and create a breakout. If the selling out of longs by the bulls combined with the selling by the bears creates a bear breakout, then that breakout becomes the start of a bear trend.
Because the monthly chart is so overbought, the odds of the next big move being up are less than those for it being down. The market might break out to a new high, but if it does, the 60 minute trading range of the past few weeks will probably be the final bull flag before a bigger correction.
As long as the Emini is withing this tight trading range, the odds are that most days will be mostly trading range days.
Summary of today’s price action and what to expect tomorrow
The Emini sold off strongly on the open and found support at the December high. It then rallied to the low of last week (LLW) and entered a trading range.
The Emini is deciding between trend resumption up on the daily and 60 minute charts and trend reversal down. The bulls have a slight advantage because both are in bull trends, but both are also overbought. The 60 minute chart continues to form subtle lower highs and lows, which is a bear trend. However, it is also in a trading range and a bull trend. At some point, one side gives up and there is a big breakout, but that has not happened yet and the Emini is still in breakout mode on the 60 minute chart. It is currently trapped between the low of last week and the December high.
See the weekly update for a discussion of the weekly chart and for what to expect going into next week.
Traders can see the end of the day bar-by-bar price action report by signing up for free at BrooksPriceAction.com. I talk about the detailed Emini price action real-time throughout the day in the BrooksPriceAction.com trading room, and a 2 day free trial is available.
When I mention time, it is USA Pacific Standard Time (the Emini day session opens at 6:30 am PST, and closes at 1:15 pm PST). You can read background information on the intraday market reports on the Intraday Market Update page.


