Trading Update: Wednesday February 21, 2024
S&P Emini pre-open market analysis
Emini daily chart
- The Daily chart reached the moving average yesterday. The bulls will buy at the moving average in an attempt to get the market to bounce as it has every time the Emini reached the daily moving average.
- The bears hope they are strong enough to get close below the daily moving average as a sign of increased strength. This would increase the odds that the Emini is transitioning into a trading range.
- The bears need to transition into a trading range if they will create a bear trend. Even if the market begins to get closes below the moving average, the odds of a deep pullback are low.
- Overall, traders should expect the market to go sideways over the next several weeks due to the higher time frames being in a tight channel.
Emini 5-minute chart and what to expect today
- Emini is down 14 points in the overnight Globex session.
- The Globex market has continued to go sideways in a broad trading range.
- Traders should assume that the open will also have a lot of sideways trading.
- Most traders will be better off waiting 6 – 12 bars before placing a trade. This is because the open is often a limit order market.
- Traders can also wait for a strong breakout up or down with follow-through.
- Because the market is close to the daily moving average, traders should pay attention to it on the open. The market may try to form an early day’s low and test yesterday’s high.
Yesterday’s Emini setups

Al created the SP500 Emini charts.
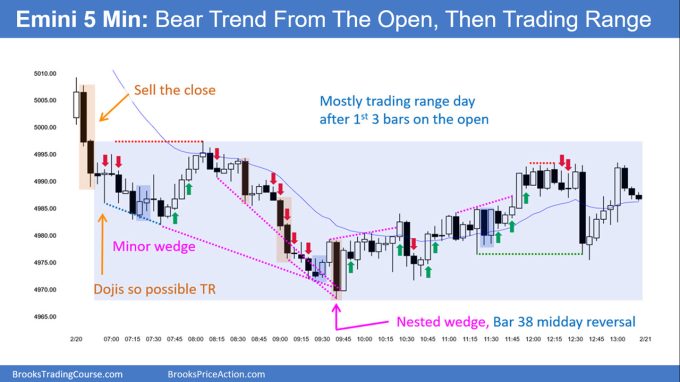
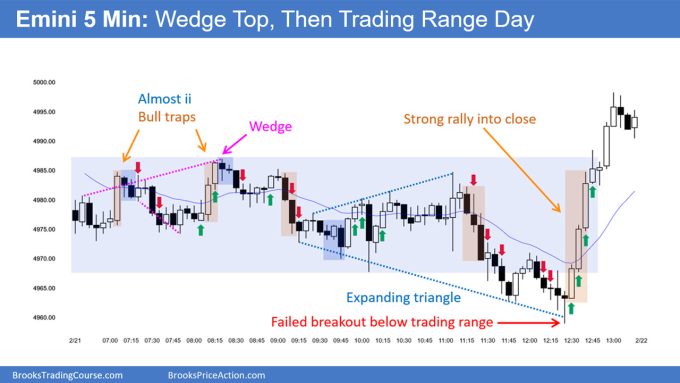
Here are reasonable stop entry setups from yesterday. I show each buy entry bar with a green arrow and each sell entry bar with a red arrow. Buyers of both the Brooks Trading Course and Encyclopedia of Chart Patterns have access to a near 4-year library of more detailed explanations of swing trade setups (see Online Course/BTC Daily Setups). Encyclopedia members get current daily charts added to Encyclopedia.
My goal with these charts is to present an Always In perspective. If a trader was trying to be Always In or nearly Always In a position all day, and he was not currently in the market, these entries would be logical times for him to enter. These therefore are swing entries.
It is important to understand that most swing setups do not lead to swing trades. As soon as traders are disappointed, many exit. Those who exit prefer to get out with a small profit (scalp), but often have to exit with a small loss.
If the risk is too big for your account, you should wait for trades with less risk or trade an alternative market like the Micro Emini.
EURUSD Forex market trading strategies
EURUSD Forex daily chart
- The EURSD closed at the moving average yesterday, which is a sign that the bear channel is converting into a trading range.
- The bulls need to do more to convince traders to buy at the moving average. They need to stabilize and get closes above the moving average, which would increase the odds of higher prices.
- Without strong closes above the moving average, the odds will favor more sideways trading.
- Overall, the market is likely going to rally sideways to up. It is higher probability for the bulls to wait for a strong breakout with follow-through above the moving average.
Summary of today’s S&P Emini price action

Al created the SP500 Emini charts.
See the weekly update for a discussion of the price action on the weekly chart and for what to expect going into next week.
Trading Room
Al Brooks and other presenters talk about the detailed Emini price action real-time each day in the BrooksPriceAction.com trading room days. We offer a 2 day free trial.
Charts use Pacific Time
When times are mentioned, it is USA Pacific Time. The Emini day session charts begin at 6:30 am PT and end at 1:15 pm PT which is 15 minutes after the NYSE closes. You can read background information on the market reports on the Market Update page.

