End of day video review
Trading Update: Monday April 22, 2024
S&P Emini pre-open market analysis
Emini daily chart
- The Emini sold off last Friday and reached the 5,000 Round Number. This will likely find profit taking a lead to a minor reversal and a bounce lasting at least a day or two.
- The daily chart has six consecutive bear bars in a microchannel which is climatic behavior. Every consecutive trend bar added lowers the probability of another consecutive trend bar. The odds are against today becoming the 7th consecutive bear bar.
- There are probably sellers above last Friday’s high. However, with last Friday reaching major support (5,000 Round Number) and the market likely transitioning into a trading range, the bounce could go far above last Friday’s high.
- This means a trader selling the high of the prior bar (last Friday’s) increases the risk of getting trapped above a surprise upside breakout.
- The odds are that if a trader sells above last Friday’s high, they will make money. However, they must be ready if they get trapped selling low in a trading range.
- The bears see the recent selloff as a strong enough breakout for a 2nd leg down and a test of the January low, bottom of the bull channel.
- Overall, the odds favor a pullback lasting a day or two. Traders will pay attention to how determined the bulls are to establish longs. If the bulls are eager to buy, bears will consider waiting for a wedge or test of the moving average before looking to establish shorts. The bears know the recent selloff is likely a minor reversal, which means the market may have to form a major trend reversal.
Emini 5-minute chart and what to expect today
- Emini is up 29 points in the overnight Globex session.
- The Globex market has rallied sideways to up for most of the overnight session (15-minute chart.
- The U.S. Session will have a decent size gap up on the open. The bulls hope the gap-up will lead to a bull trend day.
- If today is going to be a trend day, the odds favor a bull trend because of the gap up and reasons mentioned on the daily chart.
- There is no rush to enter on the open; if today is going to become a small pullback trend, there will be plenty of time to enter once the trend is clearly underway.
- Most traders should be patient on the open and wait for 6-12 bars before placing a trade. It is common for the market to get several reversals on the open before deciding on the direction of the breakout and opening swing.
- In general, there is an 80% of a trading range forming on the open and only 20% of a trend from the open. This means traders can often wait for a double top/bottom or a wedge top/bottom before the opening swing begins. This is because all trading ranges form a variation of the patterns mentioned above.
Friday’s Emini setups

Al created the SP500 Emini charts.
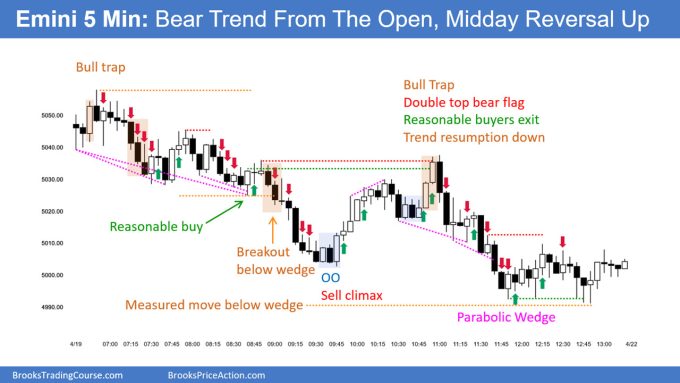
Here are reasonable stop entry setups from Friday. I show each buy entry bar with a green arrow and each sell entry bar with a red arrow. Buyers of both the Brooks Trading Course and Encyclopedia of Chart Patterns have access to a near 4-year library of more detailed explanations of swing trade setups (see Online Course/BTC Daily Setups). Encyclopedia members get current daily charts added to Encyclopedia.
My goal with these charts is to present an Always In perspective. If a trader was trying to be Always In or nearly Always In a position all day, and he was not currently in the market, these entries would be logical times for him to enter. These therefore are swing entries.
It is important to understand that most swing setups do not lead to swing trades. As soon as traders are disappointed, many exit. Those who exit prefer to get out with a small profit (scalp), but often have to exit with a small loss.
If the risk is too big for your account, you should wait for trades with less risk or trade an alternative market like the Micro Emini.
EURUSD Forex market trading strategies
EURUSD Forex daily chart
- The EURUSD is continuing to form a tight trading range after the April 12th downside breakout.
- The bears are hopeful that the tight trading range will form a bear flag and lead to a second leg down.
- The bulls are hopeful that the April 12th selloff is a 2nd leg bear trap, trapping the bears into selling low in a trading range.
- Today will probably disappoint the bears, and the downside will be limited.
- The bears who sold the low close of the recent selloff are disappointed by the three-bar tight trading range and will likely buy back some of their shorts on a retest, which is what happened last Friday.
- Overall, the odds slightly favor the bears getting a larger second leg down. The more buying pressure that the bulls are able to create, the greater the risk a second leg trap will develop.
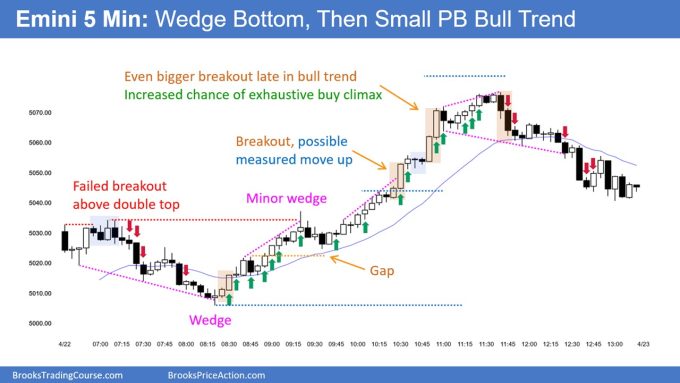
Summary of today’s S&P Emini price action

Al created the SP500 Emini charts.
See the weekly update for a discussion of the price action on the weekly chart and for what to expect going into next week.
Trading Room
Al Brooks and other presenters talk about the detailed Emini price action real-time each day in the BrooksPriceAction.com trading room days. We offer a 2 day free trial.
Charts use Pacific Time
When times are mentioned, it is USA Pacific Time. The Emini day session charts begin at 6:30 am PT and end at 1:15 pm PT which is 15 minutes after the NYSE closes. You can read background information on the market reports on the Market Update page.


