Trading Update: Tuesday March 22, 2022
Emini pre-open market analysis
Emini daily chart
- Yesterday was a doji with a bull close.
- It was also the 5th consecutive bull bar, which significantly increased today’s odds of having a bear close.
- The odds are the market will have a 1-3 day pullback, and yesterday may be the start of the pullback.
- The daily chart is in a trading range, and the market is currently in the middle of the range. In general, the middle of a trading range is always a bad area to buy or sell; however, since the bulls had a strong breakout, it increases the odds of a second leg up.
- The point I am trying to make is that the market is in the middle of a trading range so that the bulls could become disappointed quickly. What would disappoint the bulls? Some kind of micro double top or an endless pullback would be enough to confuse traders further.
- While the odds are the market will go higher and possibly test the all-time high, one must remember that the probability is not as strong as it looks. Trading Ranges always make high probability outcomes closer to 50% and low probability outcomes closer to 50%.
- The bulls want a measured move up from the bull breakout above the March 3 double top, which projects up to 4,666.25. The bulls also want to keep the gap open from the breakout above March 3 (bull breakout bar on March 18).
- Traders have to realize that this rally might be, in part, the bears stepping aside because they want to sell higher. Technically this happens on every bull breakout. What I mean is that the market is in a trading range, so the bears want to get lower highs. Even if the market rallies all the way back to the 4,600 price level, there will be aggressive bears who will sell to try and get the lower high and get another selloff to the March low.
- Overall, traders should expect a 1-3 day pullback and sideways trading.
Emini 5-minute chart and what to expect today
- Emini is up 10 points in the overnight Globex session.
- The Globex overnight market had a tight channel down, leading to sideways to up trading during the early morning hours.
- The bull rally from midnight to 1:50 AM PT was strong enough for a second leg up. The market is currently deciding if the market already had a second leg up or if the market will get a more convincing second leg up testing the Globex high.
- Traders should expect a limit order market on the open. They should look to trade limit orders if they are comfortable, or wait for a credible stop entry such as a double bottom/top or a wedge bottom/top, or lastly, a strong breakout with follow-through that makes the always in direction clear.
- Traders should expect today to close below the open and form a bear day on the daily chart. This is due to the five consecutive bull closes, and the odds do not favor a 6th straight bull day.
Yesterday’s Emini setups


Al created the SP500 Emini charts.
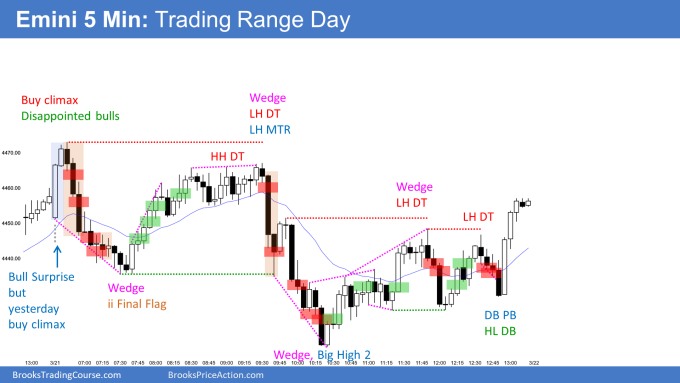
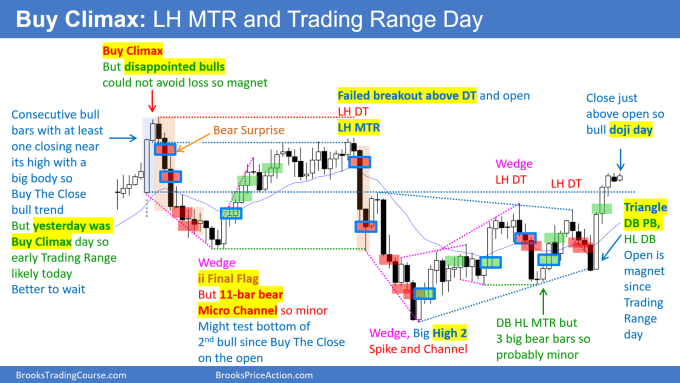
Here are several reasonable stop entry setups from yesterday. I show each buy entry with a green rectangle and each sell entry with a red rectangle. Buyers of both the Brooks Trading Course and Encyclopedia of Chart Patterns have access to a much more detailed explanation of the swing trades for each day (see Online Course/BTC Daily Setups).
My goal with these charts is to present an Always In perspective. If a trader was trying to be Always In or nearly Always In a position all day, and he was not currently in the market, these entries would be logical times for him to enter. These therefore are swing entries.
It is important to understand that most swing setups do not lead to swing trades. As soon as traders are disappointed, many exit. Those who exit prefer to get out with a small profit (scalp), but often have to exit with a small loss.
If the risk is too big for your account, you should wait for trades with less risk or trade an alternative market like the Micro Emini.
EURUSD Forex market trading strategies
EURUSD Forex daily chart

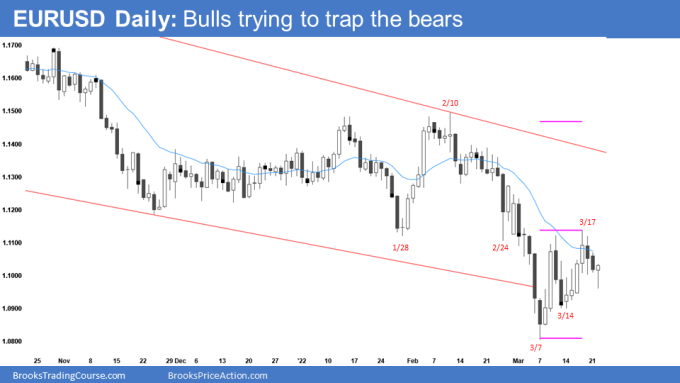
- Yesterday closed as a bear bar closing on its low. This set up a double top at the low of the 3-month trading range (a possible negative gap for the bears).
- The bears are hopeful the double top will lead to a test of the March low or March 14 higher low.
- The bulls want a bull breakout of the bear flag. Today, the bulls need to get a strong bull reversal bar to convince traders of a possible bull breakout of a bear flag.
- The bulls are hopeful that the bull breakout above the March bear flag is strong enough that the bull can get a measured move up of the bear flag (purple lines on chart). That measured move up would also be a test of the February high.
- The odds are still that the 3-month trading range will be a final flag that will lead to sideways to up trading and a likely test of the February high.
- The bulls hope they can get a breakout similar to the 4-bar bull breakout that started in the first week of February.
- Overall, the bears want a double top bear flag, and the bulls want a bull breakout of the double top bear flag. Also, it is essential to remember that even though today looks like it may reverse up, it could look much different when the bar closes. Double tops usually look like they will fail and reverse; however, in general, 40% of double tops are successful.
Summary of today’s S&P Emini futures price action and what to expect tomorrow

Al created the SP500 Emini charts.
End of day summary
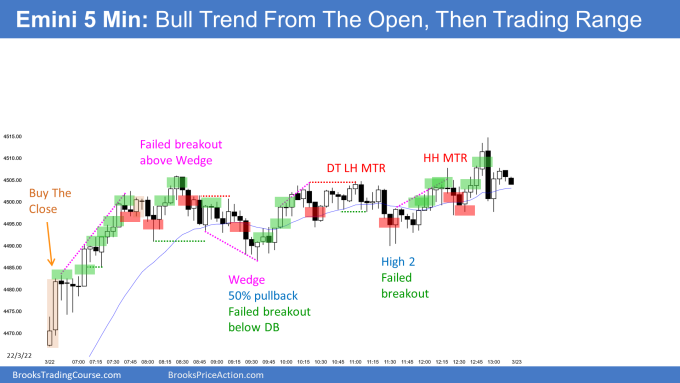
- The bulls gapped up and rallied for the first two hours of the day.
- The rally on the open looked like a bull leg in a trading range; however, the channel up was tight, which increased the probability of a trading range instead of a bear reversal.
- The bears got a reversal down around 8:30 PT. Since the rally was tight, the odds favored the selloff being minor and leading to a bear leg in a trading range.
- The bulls tied several times to test the high of the day around 11:00 PT, and the market ended up forming a triangle that led to a selloff testing the double bottom at 11:30 PT.
- The bears tried several times to get a major trend reversal and failed, leading to more trading range price action.
- Overall, the market was in a trading range for the majority of the day, which means traders were mostly scalping with limit orders.
See the weekly update for a discussion of the price action on the weekly chart and for what to expect going into next week.
Trading Room
Traders can see the end of the day bar-by-bar price action report by signing up for free at BrooksPriceAction.com. I talk about the detailed S&P Emini futures price action real-time throughout the day in the BrooksPriceAction.com on trading room days. We offer a 2 day free trial.
Charts use Pacific Time
When I mention time, it is USA Pacific Time. The Emini day session charts begin at 6:30 am PT and end at 1:15 pm PT which is 15 minutes after the NYSE closes. You can read background information on the market reports on the Market Update page.

