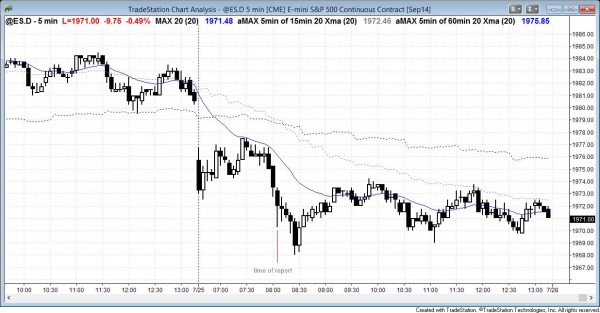
The Emini had a wedge bear flag below the moving average on the open, and the opening range was about half of an average day’s range. This is a setup for a measured move up or down and a trending trading range day. The bear breakout below the bottom of the wedge was the entry and it led to about a measured move down to just below the bottom of the gap on the daily chart. In trending trading range days, the breakout is usually brief and then the market forms the lower trading range, which it did today. The bulls had a higher low major trend reversal at 11:05, and then the bears had a wedge rally to a double top at 11:50.The market will probably have either a trend resumption down or a trend reversal up on Monday.
Posted 8:03 am PST.
The most important price action in today’s intraday update is gap down in the Emini, forming the island top in the stock market on the daily chart. I leave early today and might not be able to post the chart at the end of the day.
The Emini gapped up three days ago, and I mentioned at the time that the gap would probably become an exhaustion gap. This means that I thought that the Emini would trade back below the bottom of the gap within a week or two. From what I have been saying about the weekly chart (see the link below), I believe that the market will probably test 1900 over the next month or so, but the bears have not yet done enough to convince everyone that the pullback has begun.
Since today is Friday, the Emini will look at the highs, lows, and closes of prior weeks and at this week’s open as magnets at the end of the day.
The stock market today began with a trading range opening range and it formed a wedge bear flag at the bottom of the moving average. It had a bear breakout at 8:00 am. Since the opening range is about half the size of an average daily range, the breakout might be followed by a measured move down and then another trading range, and the day could become a trending trading range day. It is a bear trend day at this point and bears should look for reasons to sell. The odds favor at least one more leg down. The Emini will probably be in a bear trend today, but possibly just a trending trading range day.
However, the wedge bear flag might become the final bear flag, and it could be followed by a reversal up at the bottom of the gap on the daily chart. The bulls will need a strong reversal up or a major trend reversal to flip the market back to always in long.
See the weekly update for a discussion of the weekly chart.
Traders can see the end of the day bar-by-bar price action report by signing up for free at BrooksPriceAction.com. I talk about the detailed Emini price action real-time throughout the day in the BrooksPriceAction.com trading room, and a 2 day free trial is available.
When I mention time, it is USA Pacific Standard Time (the Emini day session opens at 6:30 am PST, and closes at 1:15 pm PST). You can read background information on the intraday market reports on the Intraday Market Update page.

