Posted 7:01 a.m.
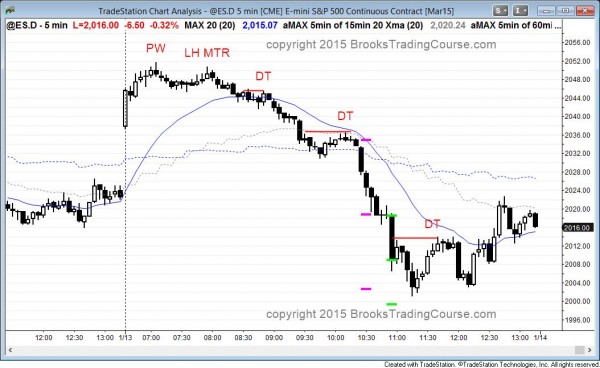
The Emini gapped above the 2 day wedge bull flag and opened with a big bull trend bar. It is always in long. However, the follow-through has been bad. This means bulls are taking quick profits, instead of buying above the high of the prior bar. If the bulls are not willing to buy high, and not willing to hold for swing trades, then the odds increase that the initial rally is a bull leg in what will soon become a trading range.
Although the first reversal down can create the high of the day, that first big bar is strong enough so that the bears will need to do more before swing traders will hold onto their shorts. The bears need either a 2nd entry short or a strong breakout with follow-through. Until then, they will scalp, and mostly short above bars.
An unusually big bar, like the one on the open, usually leads to a measured move, which can be in either direction. At the moment, the Emini is always in long with no sign of a top, but this rally is disappointing for the bulls. Disappointment is one of the hallmarks of a trading range. Although the Emini is rallying, it will probably soon enter a trading range.
There is a small third push up so there is a possible parabolic wedge top that could create the high of the day. It is still too early to know, but bears will be ready to short if there is a strong reversal down, or even several small consecutive bear bars.
My thoughts before the open: wedge bull flag within a 60 minute trading range
Last week was a big doji candle, which is a one bar trading range. Its open and close are therefore magnets. This means that the first move away would probably fail and the Emini would test back to that area.
Also, even though the 60 minute chart has a lower high major trend reversal, the symmetry is bad. There are far fewer bars in the right should of the head and shoulders top than in the left shoulder. This increases the chances the the Emini will have to trade sideways more. Sideways is a trading range. Last week’s close and the current 60 minute high are the top of the smaller range. The 60 minute chart has been in a larger trading range for 3 months. The Emini might have to test all of the way up to the all-time high, which is the top of the range.
The selloff of the past 2 days held above the bottom of the recent leg up and it has 3 pushes down. This will make traders see it as a wedge bull flag, and both bulls and bears expect it to break above the top of the wedge. There may be one more push down first to create a better looking wedge. The bears want the breakout to fail. The bulls want it to test the lower high at a minimum, and then the all-time high. The first target is Friday’s lower high of 2047. The bears do not mind a bull breakout above the bull flag as long as it fails and then has a bear breakout below the bull flag. They will then look for a measured move down to the January 6 low of 1964.25 and the December 16 low of 1963.
This 2 day selloff closed the gap up from last week, but is holding around the bottom of the gap, which is a support area. Falling below support, but not having follow-through selling is trading range price action, and it also increases the chances of a test up.
The Emini will probably gap up today and try to test the 2047 lower high.
Summary of today’s price action and what to expect tomorrow
Today had the biggest range in over a year. There was a parabolic wedge top, a lower high major trend reversal, and several double top bear flags. The low came in after a huge sell climax at 10:55 a.m.
Today was a huge bear trend day. The bear breakout that began at 10:25, led to a big selloff. The Emini tested 2000 twice and reversed up from a higher low major trend reversal.
That huge bear bar at 10:55 was a probable exhaustive sell climax. Bulls begin to look to buy and put a stop about a measured move down, based on the height of the body. The expect at least 2 legs up.
As strong as the selling was, the bulls see this as simply a pullback on the 60 minute chart. The bears are hoping that the high of the year is in and that the 20% correction has begun. Although it might have, the daily, weekly, and monthly charts are still always in long. One or two more big bear candles on the daily chart and a move below the December 16 low would probably flip the daily trend to down.
I will not be here tomorrow and will not post tomorrow.
See the weekly update for a discussion of the weekly chart and for what to expect going into next week.
Traders can see the end of the day bar-by-bar price action report by signing up for free at BrooksPriceAction.com. I talk about the detailed Emini price action real-time throughout the day in the BrooksPriceAction.com trading room, and a 2 day free trial is available.
When I mention time, it is USA Pacific Standard Time (the Emini day session opens at 6:30 am PST, and closes at 1:15 pm PST). You can read background information on the intraday market reports on the Intraday Market Update page.


