Trading Update: Thursday May 5, 2022
Emini pre-open market analysis
Emini daily chart
- The bulls got a strong bull breakout following FOMC report, with likely follow-through after FOMC rally yesterday, over the next several days.
- Yesterday was a surprise bull breakout, which means that the odds favor at least a second leg up and that the first reversal down will likely fail.
- The next target for the bulls is the April 18 low at 4,364.5, which is the breakout point of the wedge bear flag.
- The bulls hope that today will lead to strong follow-through, which would increase the odds of higher prices and a test of the 4,500 area.
- The bulls want a follow-through bar similar to what the bears got on April 22.
- The bears hope that yesterday was just a sell vacuum test of the April 28 high and that the market will form a double top here and test back to the May 2 low. While this is possible, it is not likely, and the odds favor higher prices.
- Overall, the market is probably always in long following yesterday’s strong close. Traders will pay close attention today to see what follow-through the bulls get today.
Emini 5-minute chart and what to expect today
- Emini is down 32 points in the overnight Globex session.
- The bears want to reverse yesterday’s bull breakout bar on the daily chart. The bar is so big that the best the bears will likely get is a trading range day.
- Today has the potential to be another bull trend day so that traders will be open to the possibility of a trend from the open rally.
- The bears want to disappoint the bulls today and will try hard for a bear close below todays open.
- Traders should expect a trading range open or a possible trend from the open.
- Traders should wait for a credible stop entry or a strong bull breakout with follow-through.
- If one has trouble trading the open, they should consider waiting for 6-12 bars.
- Lastly, the range has been very big, which means the risk is bigger than normal, and traders need to be able to trade small.
Yesterday’s Emini setups

Al created the SP500 Emini charts.
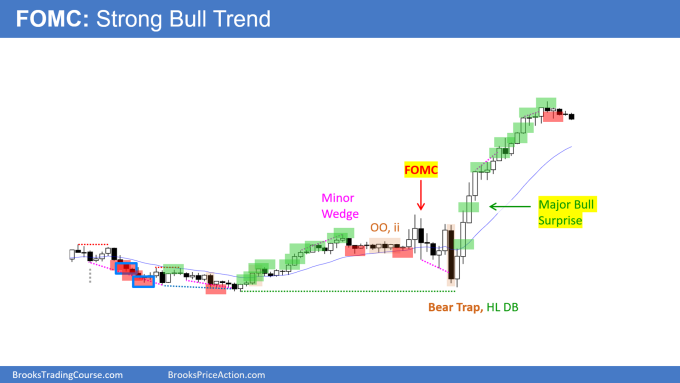
Here are several reasonable stop entry setups from yesterday. I show each buy entry with a green rectangle and each sell entry with a red rectangle. Buyers of both the Brooks Trading Course and Encyclopedia of Chart Patterns have access to a much more detailed explanation of the swing trades for each day (see Online Course/BTC Daily Setups).
My goal with these charts is to present an Always In perspective. If a trader was trying to be Always In or nearly Always In a position all day, and he was not currently in the market, these entries would be logical times for him to enter. These therefore are swing entries.
It is important to understand that most swing setups do not lead to swing trades. As soon as traders are disappointed, many exit. Those who exit prefer to get out with a small profit (scalp), but often have to exit with a small loss.
If the risk is too big for your account, you should wait for trades with less risk or trade an alternative market like the Micro Emini.
EURUSD Forex market trading strategies
EURUSD Forex daily chart

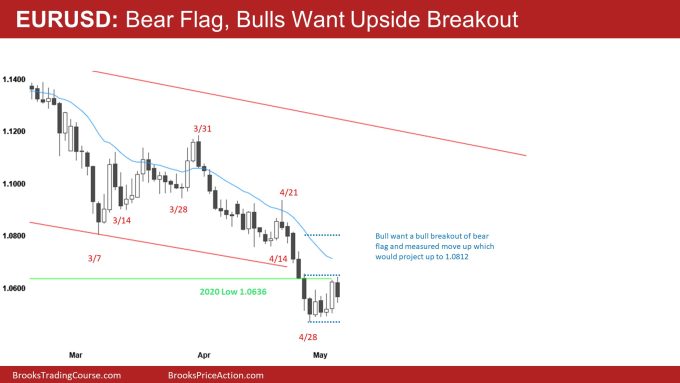
- The bulls got a strong bull breakout following the FOMC report yesterday, which created a big bull bar on the daily chart.
- The bulls went above the 2020 low and found sellers. These sellers are more likely bulls taking profits than bears selling aggressively.
- Right now, the bears have a possible second entry short below today’s bar (assuming it closes on its low). The problem the bears have is the rally since April 28 has been in a tight trading range that is also a bull microchannel.
- Another problem the bears have is that yesterday May 4, was a surprise bar, so that the odds may favor a second leg up. If the market does get a second leg, it could be 1-2 bars or several).
- The bulls have a reasonable chance at getting a bull breakout of the bear flag (April 28 – May 5) and a measured move up, which would project up to 1.0812 and the high of April 25. This measured move projection would also reach the bottom of the March – April trading range, which is a magnet.
- The bears want a second leg down from the six consecutive bear bars that started on April 21.
- Overall, the bulls have done an excellent job of making the market go sideways. However, they need to do more to convince traders that the market is going higher.
Summary of today’s S&P Emini futures price action and what to expect tomorrow

Al created the SP500 Emini charts.
End of day summary
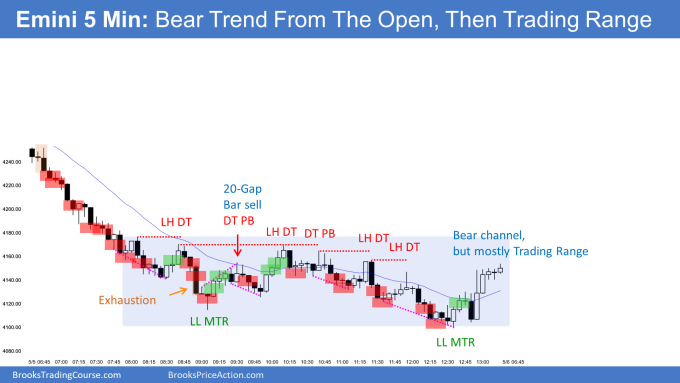
- Today was a trend from the open bear trend day.
- The bears gapped down on the open, and the market became always in short on bar 3 or bar 4.
- The market formed eight consecutive bear bars, which is a sign of strong bears, and the first reversal up was likely to be minor.
- The bulls tried several times to reverse the market from 7:45 to 9:05, and the best the bulls could get was sideways.
- The market went sideways from 8:00 PT to 11:30 PT. The bears tried to get trend resumption at 12:00; however, they failed, and the market closed at the top of the trading range, creating a tail on the daily chart.
- The bears reversed the FOMC bull breakout on May 4. However, they failed to close under yesterday’s large bull trend bar, which is a sign of trading range price action.
- As strong as the bears were, the daily chart is still in a trading range, which means there will probably be buyers at this price level.
- The bull wants a rally to test back to the May 4 high and break above it, and the bears hope that the market gaps down tomorrow and break below the May 2 lows.
See the weekly update for a discussion of the price action on the weekly chart and for what to expect going into next week.
Trading Room
Traders can see the end of the day bar-by-bar price action report by signing up for free at BrooksPriceAction.com. Al talks about the detailed S&P Emini futures price action real-time throughout the day in the BrooksPriceAction.com on trading room days. We offer a 2 day free trial.
Charts use Pacific Time
When times are mentioned, it is USA Pacific Time. The Emini day session charts begin at 6:30 am PT and end at 1:15 pm PT which is 15 minutes after the NYSE closes. You can read background information on the market reports on the Market Update page.

