Trading Update: Wednesday August 31, 2022
Emini pre-open market analysis
Emini daily chart
- The bears reached the 4,000 big round number yesterday and closed under it.
- While the bears want the market to continue down lower, the odds are that the market is in a buy zone as bears begin to take profits, and bulls will continue to buy.
- The market may continue lower without a bounce up; however, it is not likely. One target for the bulls would be the August 26 bull close.
- Today is the last day of the month, so that traders will pay close attention to the monthly chart. The bears want the day to close on its low, which would cause the monthly chart to close on or near its low.
- More likely, the bulls will disappoint the bears today, and today will have a bull close. This would create a bigger tail for the current monthly chart close.
- While the odds favor a bounce here, there are still lower targets below. The market could fall to the June 28 high before it forms a bottom. However, the odds are that the market will not fall below the June lows.
- Overall, the market is in a trading range and is in a buy zone, an area where bulls will initiate longs for scalps and bears will take partial profits.
Emini 5-minute chart and what to expect today
- Emini is up 20 points in the overnight Globex session.
- The Globex market has been sideways since yesterday’s selloff.
- As usual, traders should expect a trading range open which means a limit order market.
- Most traders should consider waiting for 6-12 bars since multiple breakout attempts often fail during the first hour.
- Also, a trader can consider waiting for a credible stop entry such as a double bottom/top or a wedge bottom/top.
- Lastly, traders can always wait for a clear breakout with follow-through that changes the Always In direction.
- Today also has the potential to be a bull trend day since the market is at the 4,000 big round number and other support levels on the daily chart.
- The single most important thing on the open is to be patient. The market often moves fast on the open, making it easy to take a bad trade. Also, the bars are usually bigger on the open, and if you take one or two big losses on the open, it can be challenging to make up the loss before the end of the day. Especially if the range gets smaller after the open, which can often happen.
- Also, since today is the final day of the month, there is an increased risk of a surprise move up or down in the last hour or two of the day as institutions decide on the close of the monthly chart.
- Overall, traders should expect a trading range day since most days are trading range days. However, traders should be open to anything, and if the open has strong consecutive trend bars, traders will begin to trade the day as a trend.
Yesterday’s Emini setups

Al created the SP500 Emini charts.
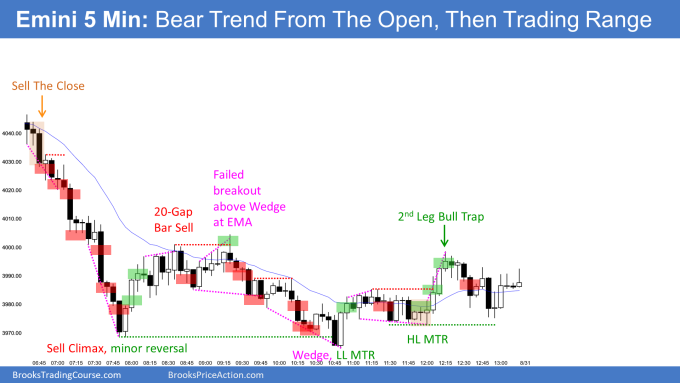
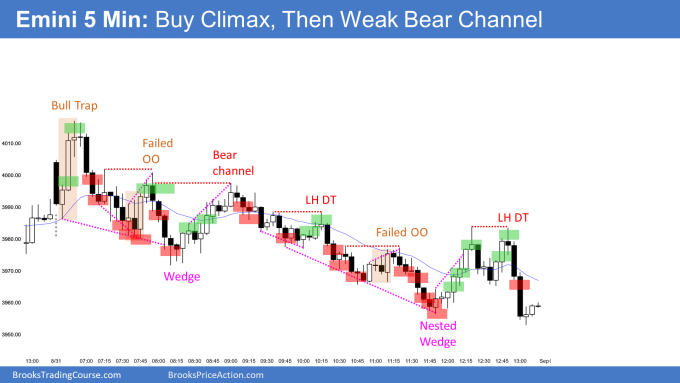
Here are several reasonable stop entry setups from yesterday. I show each buy entry with a green rectangle and each sell entry with a red rectangle. Buyers of both the Brooks Trading Course and Encyclopedia of Chart Patterns have access to a much more detailed explanation of the swing trades for each day (see Online Course/BTC Daily Setups).
My goal with these charts is to present an Always In perspective. If a trader was trying to be Always In or nearly Always In a position all day, and he was not currently in the market, these entries would be logical times for him to enter. These therefore are swing entries.
It is important to understand that most swing setups do not lead to swing trades. As soon as traders are disappointed, many exit. Those who exit prefer to get out with a small profit (scalp), but often have to exit with a small loss.
If the risk is too big for your account, you should wait for trades with less risk or trade an alternative market like the Micro Emini.
Summary of today’s S&P Emini futures price action and what to expect tomorrow

Al created the SP500 Emini charts.
End of day summary review
- Delayed due to traveling. I am back in town and will post the end of day video soon.
See the weekly update for a discussion of the price action on the weekly chart and for what to expect going into next week.
Trading Room
Traders can see the end of the day bar-by-bar price action report by signing up for free at BrooksPriceAction.com. Al talks about the detailed S&P Emini futures price action real-time throughout the day in the BrooksPriceAction.com on trading room days. We offer a 2 day free trial.
Charts use Pacific Time
When times are mentioned, it is USA Pacific Time. The Emini day session charts begin at 6:30 am PT and end at 1:15 pm PT which is 15 minutes after the NYSE closes. You can read background information on the market reports on the Market Update page.

