Emini consecutive wedge tops before budget and tax cut votes
Updated 6:49 a.m.
The Emini broke above Friday’s high to another new all-time high. Yet, Friday was a small day. There is therefore an increased risk that today reversing down to below Friday’s low and forming an outside down day. That would trigger the sell signal on the daily chart.
Today began in Friday’s range. The bulls want a trend from the open bull trend. At the moment, they have consecutive bull bars and the Emini is Always In Long. It is a Buy The Close open. Yet, the bars are not very big, and there is still an increased risk of a reversal day today. While traders are buying this rally, they will be quick to get out on a reversal down.
Pre-Open market analysis
The daily chart has a wedge higher high major trend reversal, and Friday is a sell signal bar. The weekly chart has a breakout above a series of tight trading ranges. There is therefore an increased chance of a bear trend bar on the weekly chart this week after last week’s bull trend bar. That would create a 2 bar reversal. That is similar to the doji bars, which are one bar reversals.
This is the final week of the month and the open is not far below. If this week sells off, the month would then close around or below its open. Hence, it would be a sell signal bar on the monthly chart.
The bulls are aware of all of this. They therefore want a strong rally this week to trap the bears who are selling, hoping for a reversal on all 3 time frames. They want last week’s breakout to be the start of another leg up in the year-long bull channel. However, the wedge rally and the extreme buy climaxes increase the chance of a reversal back into the trading range, and reduce the odds of another leg up.
Overnight Emini Globex trading
The Emini is unchanged in the Globex session. Because Friday is a sell signal bar in a wedge rally on the daily chart and its range was small, today will probably trade below Friday’s low. That would trigger the sell signal on the daily chart. Since the chart is in a strong bull trend, the odds are that today will be more of a trading range day than a big sell entry bar on the daily chart. Because this is a reasonable sell setup in a buy climax, there is an increased chance of a bear trend day today. While today could also be a strong bull breakout day, that is unlikely after the weak 7 day wedge rally.
Friday’s setups
I did not trade on Friday and therefore am not posting Friday’s chart.
EURUSD Forex market trading strategies
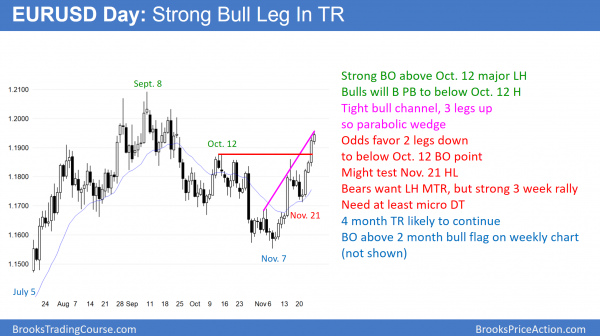
The 3 week rally broke strongly above the October 12 major lower high. Since the bull channel is tight and it has 3 legs, it is a parabolic wedge. The odds favor a pullback over the next week.
The daily chart reversed up strongly in early November from a breakout below a 4 month trading range. The rally is in a tight bull channel and it has 3 legs up. It is therefore a parabolic wedge. Furthermore, trading ranges resist breaking out. Consequently, the odds favor a 2 legged pullback over the next week or so.
Finally, trading ranges constantly disappoint the bulls and the bears. Therefore, the bulls will probably be disappointed by a deep pullback from this 2 week rally. The odds are that there will a pullback below the October 12 breakout point before a break above the September 8 top of the 4 month range.
The weekly chart (not shown) is in a strong bull trend. This 2 week rally is a reversal up from the 20 week EMA in a strong bull trend. It is therefore a breakout of a bull flag. The odds are that the bulls will buy the 1st pullback, and then try to break above the top of the 4 month range.
The top of the trading range is at major resistance on the monthly chart (not shown). This year’s rally is a pullback to test the breakout below the bottom of a 10 year trading range.
Overnight EURUSD Forex trading
Today is a bull trend day so far and therefore a good follow-through bull day after Friday’s strong breakout. The bulls want the day to close on its high. So far, it is at the top of a 40 pip tall overnight trading range on the 5 minute.
The daily chart is overbought and this is the 2nd day in a breakout above the October 12 major resistance. Since the daily chart is in a 4 month range, the odds favor a pullback starting today or tomorrow. This is more likely than another big bull trend day.
The day is still early and the daily chart is in a parabolic wedge rally. Therefore, there is an increased risk of a reversal back to below the midpoint of the day’s range. The overnight range is small, and as a result, a reversal could reach the overnight low. The 2 week rally is strong enough to make a bear trend unlikely today. Today will probably be a trading range day. Even if it closes near the high, tomorrow will probably begin pullback for a few days.
Summary of today’s S&P Emini futures price action and what to expect tomorrow
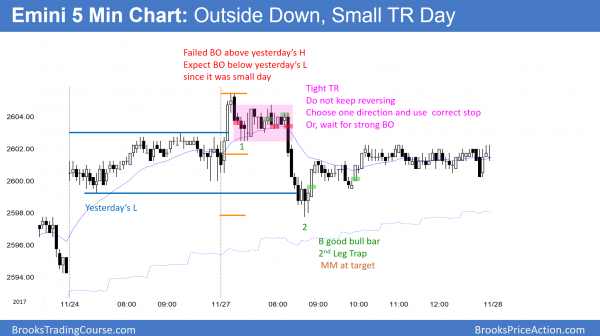
The Emini traded above Friday’s high and then below its low. Today was therefore an outside day. It was also a sell entry bar on the daily chart for the wedge top.
Today traded above Friday’s high and then below its low. This created an outside down day. Furthermore, since Friday was a sell signal bar, today triggered a sell signal on the daily chart. Yet, Friday was a small doji, and therefore a weak sell signal bar. Today was not a big bear trend day. Hence, it was a weak sell entry bar. This is the 3rd consecutive small day. It therefore increases the odds of another small day tomorrow.
This week has an increased chance of reversing last week. This is because last week broke above a 4 week tight trading range, and most breakouts reverse.
See the weekly update for a discussion of the price action on the weekly candlestick chart and for what to expect going into next week.
Traders can see the end of the day bar-by-bar price action report by signing up for free at BrooksPriceAction.com. I talk about the detailed S&P Emini futures price action real-time throughout the day in the BrooksPriceAction.com trading room. We offer a 2 day free trial.
When I mention time, it is USA Pacific Standard Time (the Emini day session opens at 6:30 am PST, and closes at 1:15 pm PST). You can read background information on the intraday market reports on the Intraday Market Update page.


