Emini buy climax and North Korea catalyst
Updated 6:51 a.m.
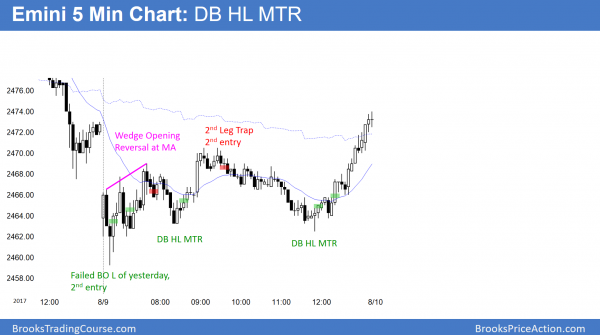
The Emini sold off on the open, but it is at the bottom of a month-long trading range. Yesterday was a good bull bar on the daily chart. Today opened near yesterday’s low. If today closes on its low, that combination would be a strong sell signal on the daily chart.
At the moment, the Emini is Always In Short. The bulls want an Opening Reversal up from below the July range. They will probably need at least a micro double bottom. While it is still possible that today could be a bull trend day, it will more likely be either a bear day or a trading range day.
The bears have a trend from the open bear trend and a reasonable chance of a bear trend day. Because the Emini is at the bottom of a month long trading range, it might bounce back to the moving average. Yet, the bears will try to create a double top or wedge bear flag near the moving average. This could take 1 -2 hours. If they succeed, it would be a reasonable short for a swing down.
Pre-Open market analysis
The Emini spend most of yesterday in a trading range around last week’s low. Yet, it rallied into the close and the day became a buy signal bar on the daily chart.
Last week was a doji bar on the weekly chart and therefore a weak buy and sell signal bar. Monday traded below last week’s low after it traded above its high. Hence, both the weekly buy and sell signals triggered. But, since the signal bar on the weekly chart is weak, the bears need a strong bear bar for their entry bar this week.
The daily chart is still in its month-long trading range. Hence, the bears need to do more to convince traders that a bear breakout will succeed. Yesterday’s late rally made yesterday a buy signal bar on the daily chart. Despite that, the bears can still get their needed follow-through selling today.
Overnight Emini Globex trading
The Emini is down 10 points in the Globex market, and it will therefore open around last week’s low. The bears want this week to close below last week’s low. That would therefore create an outside down bar on the weekly chart. Since that is a sign of strong bears, traders would then begin to think that a correction might be starting on the daily chart. If so, day traders will start looking for more bear swing trades. This is because an early trend often has big moves.
Because the Emini’s higher time frames are in buy climaxes, there is an increased risk of a correction on the daily chart. The big swings of the past 2 days increase the chances for the correction. They also are very good for day traders who prefer to swing trade. The odds are that today will again have at least one swing. Since tomorrow is Friday and its close determines the appearance of the weekly chart, today might again oscillate around last week’s low.
Yesterday’s setups
Here are several reasonable stop entry setups from yesterday. I sometimes also show limit order entries and entries on the close of bars.
EURUSD Forex market trading strategies
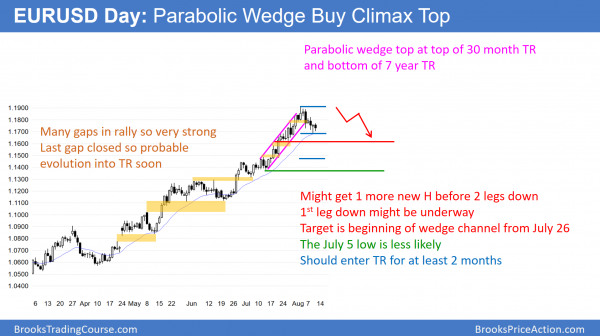
The daily chart of the EURUSD Forex market pulled back to the moving average in a wedge bull flag. Since the 5 month rally is climactic, the odds favor a 2 legged, 300 pip correction down to the July 26 low. There might be 1 more new high 1st.
The daily chart of the EURUSD Forex market has pulled back in a wedge bull flag for the past 8 days. Since this is the 1st test of the 20 day exponential moving average in more than 20 days, bulls will buy here. Yet, this bull flag is following a buy climax at resistance. Therefore, this pullback to the average price might be the start of a correction down to the July 26 start of the most recent bull channel.
Nested channel
The channel from April is nested. There was a breakout on July 20 and a 2nd channel began on July 26. Its low is 300 pips down from the high. That is a likely target for a correction. The bulls will probably buy there. Hence, the daily chart would therefore bounce and enter a trading range for at least 2 months.
The bulls need the monthly chart to break back into the 10 year trading range above 1.2000. If they fail over the next few months, then the odds favor a 600 pip correction down to the July 5 low.
Overnight EURUSD Forex trading
The 5 minute chart has bounced from around 1.1700 4 times over the past 5 days. The bulls want a breakout above the 8 day wedge bull flag. They then want the 8 month bull trend to resume. The bears want a trading range, whether or not there is one more new high 1st. Hence, day trading bulls are buying selloffs for swings and scalps. In addition, day trading bears are selling rallies for swings and scalp. Many of the legs over the past several weeks have been big enough for scalpers to go for 20 – 30 pips profit.
A wedge bull flag is a breakout pattern. While the odds of a bull breakout are slightly higher, the month long buy climax make a bear breakout almost as likely.
Summary of today’s S&P Emini futures price action and what to expect tomorrow
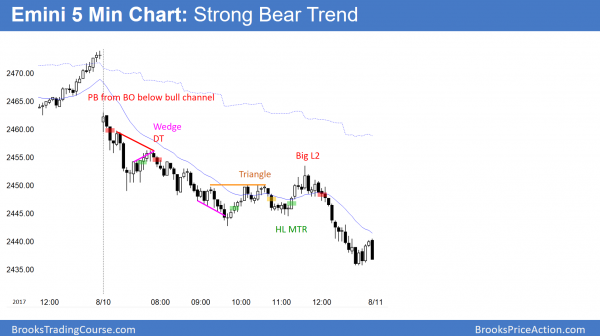
The bears had a strong selloff. The bulls got 2 legs up, but failed. The bear trend resumed into the close.
Today was a big bear bar on the daily chart. The odds are that a correction down to the May and possibly March lows has begun. The bears want at least a small bear body on the daily chart tomorrow. The bulls need a strong reversal up soon if they are to stop this.
See the weekly update for a discussion of the price action on the weekly candlestick chart and for what to expect going into next week.
Traders can see the end of the day bar-by-bar price action report by signing up for free at BrooksPriceAction.com. I talk about the detailed S&P Emini futures price action real-time throughout the day in the BrooksPriceAction.com trading room. We offer a 2 day free trial.
When I mention time, it is USA Pacific Standard Time (the Emini day session opens at 6:30 am PST, and closes at 1:15 pm PST). You can read background information on the intraday market reports on the Intraday Market Update page.


