Trading Update: Thursday March 30, 2023
S&P Emini pre-open market analysis
Emini daily chart

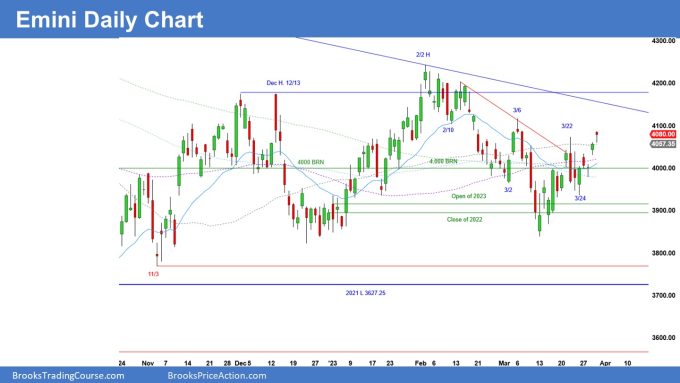
- The Emini gapped up yesterday and closed near its high. Bulls chance for strong breakout above the March 22nd tight trading range.
- Next, the bulls want strong follow-through today, increasing the odds of a measured move and a test of the February high.
- The bears see the March 13th to March 22nd rally as a bear flag. They do not mind if the market goes above March 22nd as long as the breakout fails quickly and reverses down.
- The bulls have a chance to get a measured move up of the March 13th to March 22nd range, which would project up to around 4,300.
- Ultimately, the bulls hope the rally that began in March is a double bottom, higher low major trend reversal. It is important to remember that major trend reversals typically lead to trading range price action. This means that most major trend reversals do not lead to strong breakouts and are typically legs in a trading range.
- The bulls want the early formation of a small pullback bull trend. While the rally up from March is not yet a clear small pullback bull trend, the market could rally far if the bulls start forming subtle or negative gaps.
- Small pullback trends begin as legs in trading ranges, like the one here (beginning of March). The rally looks weak, so bears start to scale into shorts; however, instead of a downside breakout, the market continues higher. This squeezes the bears out of shorts adding to the buying pressure. The Bulls would also be trapped out of a longs, and once they detect the small pullback behavior, they will buy any pullback, even if it is a bar or two.
- Overall, today is essential to see if the bulls can get a follow-through bar closing on its high or at least above its midpoint. The bears want to prevent this and form a strong bear bar.
Emini 5-minute chart and what to expect today
- Emini is up 24 points in the overnight Globex session.
- On the 60-minute Globex chart, the bulls still have a tight bull channel that began during the March 28 overnight hours.
- The rally is currently a small pullback bull trend on the 60-minute chart. The bears need to make the market go sideways for several bars, or else the odds of higher prices will continue.
- As I often say, traders should consider not trading the first 6-12 bars unless they are comfortable trading with limit orders.
- Most traders should wait for a credible swing trade on the open.
- There is typically a greater than n 80% chance that a swing trade will begin on the open before the end of the second hour. The opening swing trade will often begin after the formation of a double top/bottom, or a wedge top/bottom. Traders should see if the market is forming one of these patterns, as it can lead to a credible stop-entry swing trade lasting at least 10 bars and two legs.
- Traders should also remember that there is typically a 50% chance that the initial move on the open will fail and reverse. There is also an 80% chance that the initial move on the open will get a minor pullback. This means there is really to enter on the open.
- Overall, the critical thing on the open is to be patient, and if one is confused about what the market is doing, just step aside.
- Lastly, below is an Ask Al Brooks Video that is a great reminder to avoid big losses, especially on the open. Be patient and remember that a trade is never overdue.
Emini intraday market update
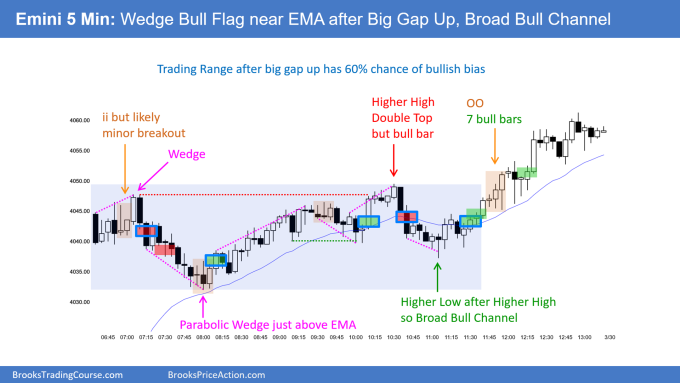
- The Market gapped up on the open and went sideways for the first 6 bars.
- The bears have three consecutive bear closes down to bar 9 (7:15 AM PT). This is a strong enough bear breakout that the first reversal up will probably fail and lead to a second leg down. Because of the gap up, a trading range is more likely than a bear trend day.
- 7:20 Bulls formed a bull reversal bar near the moving average and three consecutive bull bars up to 7:35. Probably at least a small 2nd leg up likely. However, it was reasonable to sell the 7:15 AM bear close. This means the market may have to test the 7:15 Close later in the day.
- Trading Range Price action is expected until there is a clear breakout of the range. Bulls want a strong upside breakout and bull trend day which would be follow-through on the daily chart. \
- 8:05 AM PT: The bulls have a wedge bottom near the moving average. The bulls want a second leg up after the three-bar rally up to 7:35 AM PT. Bulls need a strong upside breakout above the bar 7 high, otherwise, a trading range day is most likely.
- Possible bull trend day. Bulls have a big gap up so it is important to consider a possible spike and bull channel today. So far, the bulls do not have a clear Breakouts (8:10 AM PT).
Yesterday’s Emini setups

Al created the SP500 Emini charts.
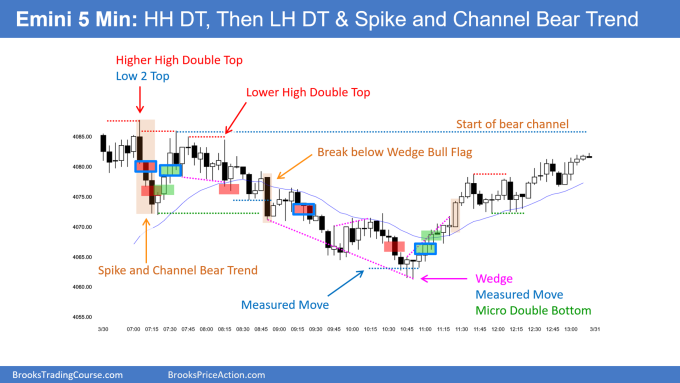
Here are several reasonable stop entry setups from yesterday. I show each buy entry with a green rectangle and each sell entry with a red rectangle. Buyers of both the Brooks Trading Course and Encyclopedia of Chart Patterns have access to a near 4-year library of more detailed explanations of swing trade setups (see Online Course/BTC Daily Setups). Encyclopedia members get current daily charts added to Encyclopedia.
My goal with these charts is to present an Always In perspective. If a trader was trying to be Always In or nearly Always In a position all day, and he was not currently in the market, these entries would be logical times for him to enter. These therefore are swing entries.
It is important to understand that most swing setups do not lead to swing trades. As soon as traders are disappointed, many exit. Those who exit prefer to get out with a small profit (scalp), but often have to exit with a small loss.
If the risk is too big for your account, you should wait for trades with less risk or trade an alternative market like the Micro Emini.
EURUSD Forex market trading strategies
EURUSD Forex daily chart

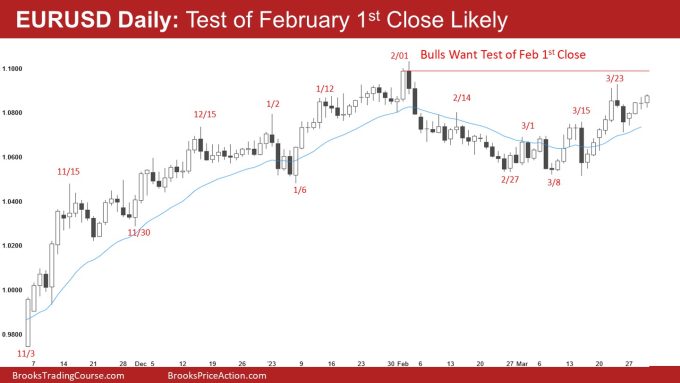
- The EURSUD is trying to break out above the March high and test the February 1st close.
- At the moment, the market is Always in Long and probably going higher.
- There are probably sellers not far above. However, the market will probably want to test the February 1st close before the sellers come in.
- Traders will pay close attention to the test of the February 1st close. If the market starts to stall before reaching it, that will increase the odds of sellers above and continued trading range price action.
- If instead, the market does not hesitate at the February 1st close and breaks far above it, it will increase odds of higher prices.
- The market may have to pull back before reaching the February 1st close and test the March 24th bear bar.
- Overall, the bulls want a strong breakout above the February high, and the bears want the market to develop more selling pressure. If they can form more selling pressure, the bears will have a chance at a major trend reversal.
Summary of today’s S&P Emini futures price action

Al created the SP500 Emini charts.
End of day video review
Brad hosted a live stream End of Day Review at 1:00pm PT and answered questions.
See the weekly update for a discussion of the price action on the weekly chart and for what to expect going into next week.
Trading Room
Al Brooks and other presenters talk about the detailed Emini price action real-time each day in the BrooksPriceAction.com trading room days. We offer a 2 day free trial.
Charts use Pacific Time
When times are mentioned, it is USA Pacific Time. The Emini day session charts begin at 6:30 am PT and end at 1:15 pm PT which is 15 minutes after the NYSE closes. You can read background information on the market reports on the Market Update page.

