Trading Update: Tuesday March 29, 2022
Emini pre-open market analysis
Emini daily chart
- Emini bulls breaking above 4,600 with the Emini reaching the February high today and 4,600 round number during the Globex session
- So far, the bulls have a strong breakout since the March 14 low.
- The bulls are hopeful that this rally is strong enough to reach the all-time high, and the bulls may get there.
- Traders have to remember that the market is in a trading range, which means traders will expect disappointment soon.
- The bears are hopeful that the bulls will fail around the February high and that the bears will be able to get a micro double top that would be a part of a larger double top with the February high.
- The bears see the overall daily chart as a trading range, so they do not care if the market reaches the all-time high. The bears will still sell at the price level, betting on more trading range price action and possibly starting a bear trend.
- Overall, while the market is in a trading range, it is too early to sell. The current rally is too strong, so traders should wait for more selling pressure to develop.
Emini 5-minute chart and what to expect today
- Emini is up 35 points in the overnight Globex session.
- The bulls had a strong rally during the Globex session.
- The market will likely open up around the 4,600 price area, and will probably not go much higher today and will instead likely form a trading range during the day session.
- The market may test back to the February 2 high on the open, so traders should be aware of that price level
- Traders should expect a trading range open, and if not comfortable with limit orders, wait for a credible stop entry or strong breakout with follow-through.
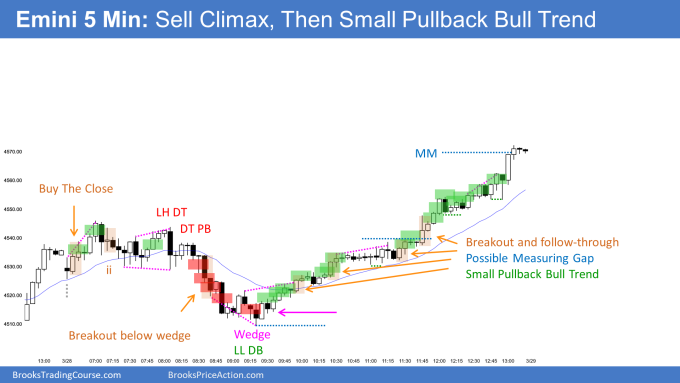
Yesterday’s Emini setups

Al created the SP500 Emini charts.
Here are several reasonable stop entry setups from yesterday. I show each buy entry with a green rectangle and each sell entry with a red rectangle. Buyers of both the Brooks Trading Course and Encyclopedia of Chart Patterns have access to a much more detailed explanation of the swing trades for each day (see Online Course/BTC Daily Setups).
My goal with these charts is to present an Always In perspective. If a trader was trying to be Always In or nearly Always In a position all day, and he was not currently in the market, these entries would be logical times for him to enter. These therefore are swing entries.
It is important to understand that most swing setups do not lead to swing trades. As soon as traders are disappointed, many exit. Those who exit prefer to get out with a small profit (scalp), but often have to exit with a small loss.
If the risk is too big for your account, you should wait for trades with less risk or trade an alternative market like the Micro Emini.
EURUSD Forex market trading strategies
EURUSD Forex daily chart

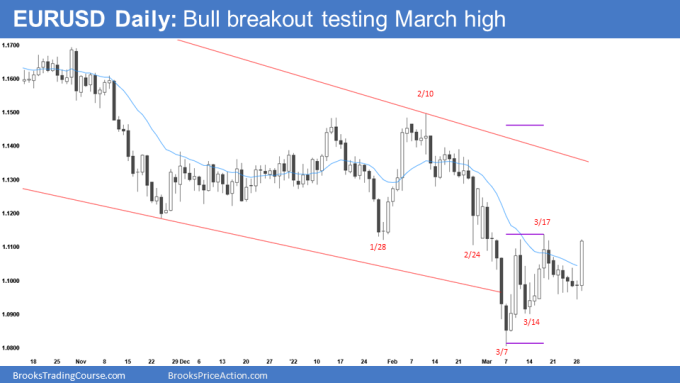
- The bears are currently giving up on the idea of a double top at the 3-month trading range low, which is why the daily chart has a big bull bar today.
- Currently, the odds favor a bull breakout above the March bear flag and a test of the 3-month trading range and the top of the large bear channel line.
- The bulls want today to close near its high, which would increase the odds of follow-through tomorrow.
- I have been saying that the bears needed to get follow-through after the March 21 double top stop entry, and while the bears had a tight channel, it was becoming difficult for the bears to stay short.
- This means that as the market was going down to March 28, the bear bars were getting weaker, which is the opposite of what a bear wants, which is why the bears gave up on the open of today.
- Overall, traders should expect a test of the March high and for the bulls to try and break above the March bear flag and try for a measured move up. The bulls need consecutive strong bull bars to convince traders that the market will reach the February high.
Summary of today’s S&P Emini futures price action and what to expect tomorrow

Al created the SP500 Emini charts.
End of day summary
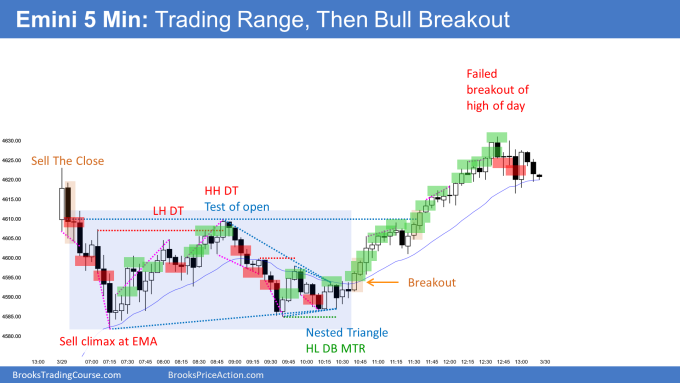
- The bears had a gap up that led to a wedge bottom testing the moving average around 7:15 am.
- The market rallied back to the open of the day around 8:30 am, confirming that the market was likely forming a trading range.
- The market sold back off around 10:30 and formed a triangle nested inside a larger triangle, meaning breakout mode. The probability was close to 50%, although the odds would be slightly higher for the bulls with the gap up open.
- Next, the market rallied in a small pullback bull trend up until the close causing the day to close on its high.
- The three consecutive bull bars after 11:30 changed the character of the day from a trading range to a possible bull breakout of the trading range and measured move up. This was the point where bears were giving up on a potential failed bull breakout of the opening trading range.
See the weekly update for a discussion of the price action on the weekly chart and for what to expect going into next week.
Trading Room
Traders can see the end of the day bar-by-bar price action report by signing up for free at BrooksPriceAction.com. I talk about the detailed S&P Emini futures price action real-time throughout the day in the BrooksPriceAction.com on trading room days. We offer a 2 day free trial.
Charts use Pacific Time
When I mention time, it is USA Pacific Time. The Emini day session charts begin at 6:30 am PT and end at 1:15 pm PT which is 15 minutes after the NYSE closes. You can read background information on the market reports on the Market Update page.

