Emini bull flag breakout near all time high
Updated 6:47 a.m.
Today opened with a big bull doji bar, which is a 1 bar trading range. In addition, it was in the middle of yesterday’s range. Furthermore, limit order bears made money scaling in above the high of the 1st bull bar. Finally, most days over the past month have had a lot of trading range price action. That one bar therefore increases the chances of a lot of trading range trading again today.
Yesterday gapped far above a 3 week bull flag. Furthermore, the all time high is a strong magnet and it is only about 7 points above yesterday’s high. The odds are that the Emini will get closer. However, the bulls so far have not done enough to make traders believe today will be a bull trend day.
Since yesterday’s range was small, and the breakout above it so far is weak, the bears might get an outside down day. However, this quiet open probably will result in a trading range for the 1st hour or so. In addition, it increases the chances of another mostly sideways day.
Pre-Open market analysis
The Emini gapped above a 3 week bear channel yesterday. Yet, it is still within its 2 month trading range. In addition, the weekly chart’s buy climax is unusually extreme. Therefore, if the bulls get a new all-time high, the rally will probably not last more than a few weeks.
The Emini went a little above the June 29 sell climax high on the 60 minute chart. As usual, it then went sideways for several bars on the 60 minute chart. The breakout was big enough to make higher prices likely today or tomorrow. However, the odds still favor the weekly chart pulling back to its moving average soon.
Bull leg in trading range
The rally since March 27 looks like a bull leg in a trading range. However, despite many attempts at a top, no top has been strong. Consequently, the daily and weekly chart keep probing higher, in search of a top. Traders will not see the rally as part of a trading range until there is a bear leg. However, since the weekly chart is so climactic and climaxes usually lead to trading ranges, that is what is likely to happen here. The bottom of the range will probably be around the March bottom of the 5 month bull channel. The bear leg, once it begins, will probably last several months.
Overnight Emini Globex trading
The Emini is up 2 points in the Globex market. The bulls want strong follow-through buying after yesterday’s gap up. Yet, yesterday was a trading range day in a 2 month trading range. Today will probably be another trading range day.
Since gaps in trading ranges usually close, yesterday’s gap will probably close within a week. If the Emini gaps down on any day over the next week, that would create another island top. Island tops and bottoms are common in trading ranges and therefore rarely important.
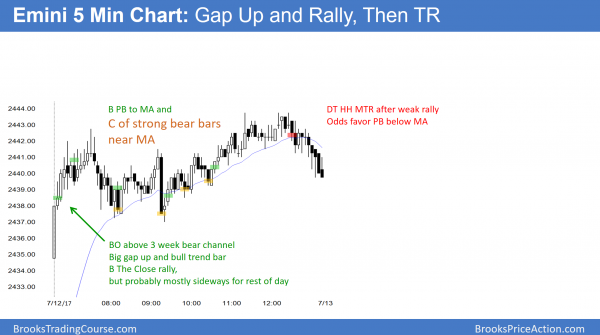
Yesterday’s setups
Here are several reasonable stop entry setups from yesterday. I sometimes also show limit order entries and entries on the close of bars.
EURUSD Forex market trading strategies
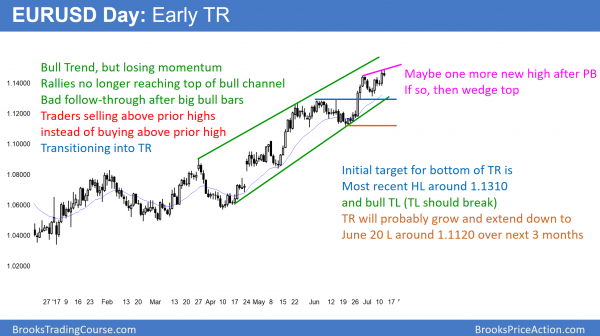
The EURUSD daily Forex chart is in a bull trend. However, it is stalling far below the top of the bull channel. In addition, it is at the top of the 2 year range,
Furthermore, it is having bear bars after strong bull bars. Consequently, it is probably transitioning into a trading range that will last several months.
The EURUSD weekly chart has rallied to 1.1500 many times over the past 2 years. Yet, it has failed to strongly break above it. Will this time be different? Probably not.
The daily chart is stalling far below the top of its 7 month bull channel channel. Furthermore, traders can begin to draw wedge tops. If there is one more new high after a small pullback, that would probably create another wedge top. The bulls need a strong breakout above 1.1500 and then 1.1700 before traders will conclude that the weekly and monthly charts have broken out into a bull trend. While the current rally might test up to 1.1700, it looks like it is beginning to stall here.
Trading range for at least 2 months
The EURUSD daily chart will probably soon test down to the July 5 low around 1.1310. It will probably bounce there, which is also at the 4 month the bull trend line. However, that bounce will probably fail and traders will begin to see a small trading range.
Whether or not the bull trend resumes up to 1.1700, the daily chart will probably test down to the June 20 low. This will result in a bigger trading range. It will be both taller and longer. The process will probably take several months.
Consequently, if a trader has been long for the past few months, this is a good area to begin to take profits. In addition, if a trader is looking to position himself for the next several months, he will begin to look to sell. A bear leg in a 3 month trading range is more likely than a bear trend down to the bottom of the 2 year range. Therefore, traders on the daily chart will probably look to exit with 200 – 300 pips profit on tests down to support.
Overnight EURUSD Forex trading
The 240 minute EURUSD Forex chart has been in a 100 pip range for 6 days. As a result, day traders have been able to scalp for 20 – 40 pips. The EURUSD 5 minute chart sold off 80 pips overnight, and retraced half over the past 2 hours. Big Down, Big Up means Big Confusion. That usually results in a trading range. Therefore today will probably be a continuation of the 6 day range. Most of the trading over the past 5 hours has been in a 30 pip range. Hence, scalpers will probably look for only 10 – 20 pips today in their day trades.
Summary of today’s S&P Emini futures price action and what to expect tomorrow
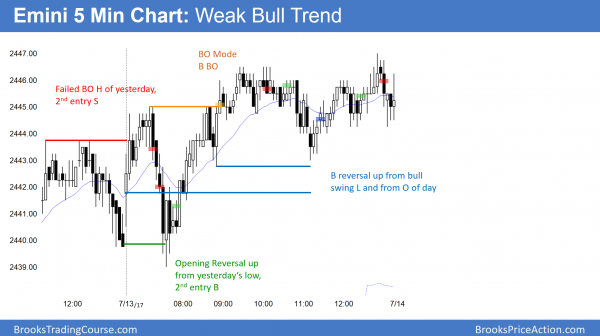
The Emini had an opening reversal up on the open and broke to a new high. However, it then stayed in a tight trading range.
The Emini had weak follow-through buying today after yesterday’s gap up. Yet, yesterday’s gap above the 3 week bear channel was big. Furthermore, the bulls now have consecutive bull bars. Finally, the all-time high is a magnet and only about 5 points above today’s high. The odds are that the Emini will get closer to the all-time high. However, because the weekly buy climax is so extreme, it is likely that the Emini will trade down for several months. Since there is no clear top yet or strong reversal down, the odds still favor at least slightly higher prices.
If the bears create a gap down at any point over the next week or two, that would form an island top. But, an island top in a trading range is common. It therefore only has minimal bearish significance.
See the weekly update for a discussion of the price action on the weekly candlestick chart and for what to expect going into next week.
Traders can see the end of the day bar-by-bar price action report by signing up for free at BrooksPriceAction.com. I talk about the detailed S&P Emini futures price action real-time throughout the day in the BrooksPriceAction.com trading room. We offer a 2 day free trial.
When I mention time, it is USA Pacific Standard Time (the Emini day session opens at 6:30 am PST, and closes at 1:15 pm PST). You can read background information on the intraday market reports on the Intraday Market Update page.


