Trading Update: Tuesday October 19, 2021
Emini pre-open market analysis
Emini daily chart
- Yesterday traded below Friday’s low and then above Friday’s high, making it an outside up day.
- It was the 4th consecutive bull day. Since it closed above Friday’s high, there is an increased chance of at least slightly higher prices today with breaking above lower high of September 3.
- The day after an outside up day often largely overlaps the outside up day. Therefore, while a bull outside up day slightly increases the chance of a big bull trend, it is only slightly bullish.
- When there is a gap above an outside up day, there is an increased chance of a selloff that closes the gap.
- Since this is the 5th day in a rally within a 4-month trading range, there is an increased chance of disappointed bulls. That means traders should be ready for a possible sideways to down day today.
- Traders are still deciding if the 2-week rally is just a bull leg in the 4-month trading range or a resumption of the bull trend.
- There are now two consecutive bull bars closing near their highs and above the September 23 high. That makes it likely that the rally will reach the next resistance, which is the all-time high.
- But because of the 4-month trading range, traders should expect a reversal from around that high, even if the Emini goes a little above it first.
- Until there are consecutive closes above the September 2 high or below the October 4 low, all rallies and selloffs are more likely to be just legs in the trading range.
Emini 5-minute chart and what to expect today
- Emini is up 15 points in the overnight Globex session. It will therefore probably gap up.
- However, the day after a buy climax day has a 75% chance of at least a couple hours of sideways to down trading that starts by the end of the 2nd hour.
- There is only a 25% chance of a 2nd consecutive strong bull trend today. If today is a bull trend, it should be a weaker variety, like a broad bull channel or a trending trading range day.
- Also, since today is gapping up in a 50-day rally, but the rally is in a 4-month trading range, there is an increased chance of disappointing follow-through for the bulls today.
- Can today be a strong bear trend day and sell off from the open and close the gap up? Of course it can, but if it sells off, there will probably be a lot of trading range trading. This is because a strong rally does not typically reverse into a bear trend without 1st transitioning to a trading range.
Yesterday’s Emini setups

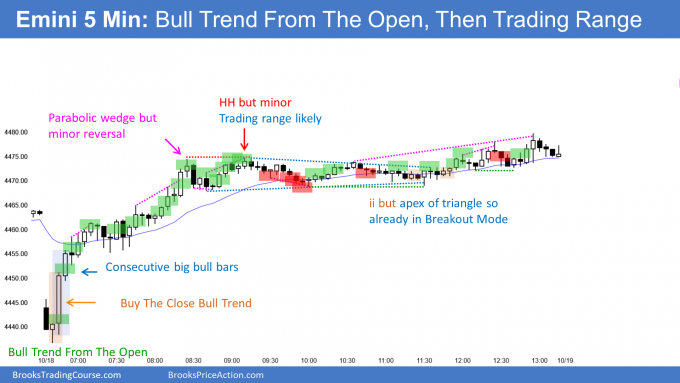
Here are several reasonable stop entry setups from yesterday. I show each buy entry with a green rectangle and each sell entry with a red rectangle. Buyers of both the Brooks Trading Course and Encyclopedia of Chart Patterns have access to a much more detailed explanation of the swing trades for each day (see Online Course/BTC Daily Setups).
My goal with these charts is to present an Always In perspective. If a trader was trying to be Always In or nearly Always In a position all day, and he was not currently in the market, these entries would be logical times for him to enter. These therefore are swing entries.
It is important to understand that most swing setups do not lead to swing trades. As soon as traders are disappointed, many exit. Those who exit prefer to get out with a small profit (scalp), but often have to exit with a small loss.
If the risk is too big for your account, you should wait for trades with less risk or trade an alternative market like the Micro Emini.
EURUSD Forex market trading strategies
EURUSD Forex daily chart

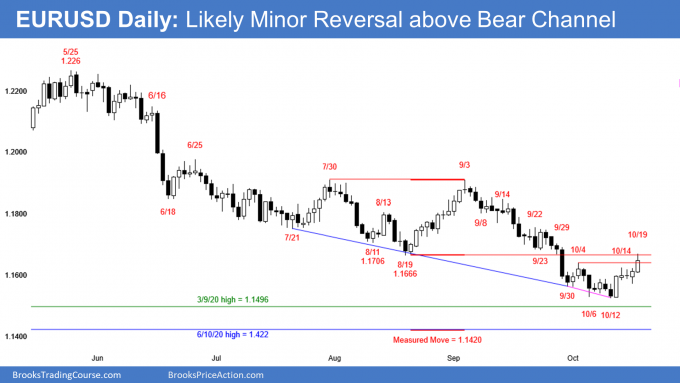
- The EURUSD went sideways on Thursday and Friday after a big bull day. That rally was from a micro wedge bottom and from just below the bottom of a yearlong trading range.
- Also, after 5 consecutive bear bars on the weekly chart, the EURUSD was oversold.
- Bulls bought below Friday’s low, and yesterday rallied to above Friday’s high. Yesterday was therefore an outside up day. That increased the chance of higher prices today.
- That is especially true since I have been saying that there would soon be a reversal up to at least a little above the August 19 low (the August 20 low on the weekly chart). That was the breakout point of 3 years ago, and the EURUSD has been in a trading range for a year. When there is a trading range and nearby support or resistance, the market usually goes through it before reversing.
- Traders are deciding if the rally will continue up to the September 3 high, or form a lower high and then reverse back down to below the March 9, 2020 breakout point.
- It should soon rally for several weeks, and that rally might be underway.
- However that March 9, 2020 high is an important magnet below. Also, the 5-day rally is a breakout above a tight bear channel since September 3. The 1st reversal up is typically minor. That means there is usually a test back down.
- Unless the EURUSD accelerates up strongly over the next few days, it will probably test the October 12 low, and it still could dip at least a little below that March 3, 2020 high at around 1.15.
- Whether this is the start of the 3 week rally or if there is one more brief new low, the bulls will try to get back to the September 3 high within a couple months.
- Today rallied from the open and pulled back a little from just above the August 19 low, which was the near-term target.
- If today closes 20 or more pips above that low, it should then continue up to the September 22 lower high.
- More likely, it will stall around the August 19 low. Traders will then decide between a test of the October 12 low and the September 22 high.
Summary of today’s S&P Emini futures price action and what to expect tomorrow

End of day summary
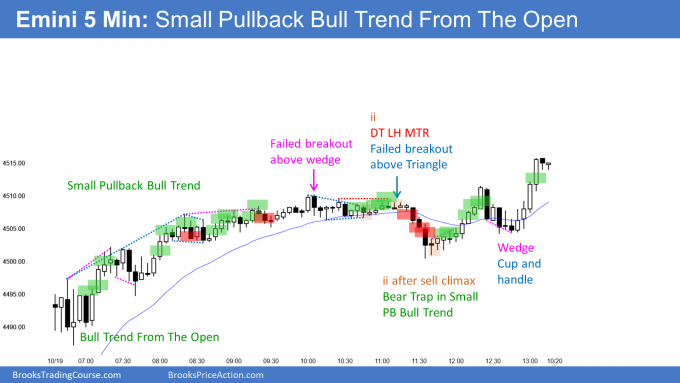
- The Emini gapped up and rallied in a Small Bull Trend From The Open.
- The rally was not particularly strong. The Emini entered in a tight trading range for several hours in the middle of the day.
- It reached the EMA by going sideways and formed a triangle.
- There was a strong reversal down to the start of the bull channel (today was a Spike and Channel Bull Trend).
- An ii led to a strong reversal up to a new high. The selloff was a Bear Trap.
- This was the 1st close above the 4500 Big Round Number in over a month, which is good for the bulls.
- The Emini might gap up again tomorrow. It might even gap to a new all-time high.
- The magnet above is the all-time high of September 2.
- The bulls want a strong breakout above that high.
- However, after going sideways for 4 months and with the buy climax on the monthly chart, the Emini will probably have a difficult time getting much above 4,600, if it gets there.
- Today was the 5th consecutive bull day, which is getting extreme.
- Because it is still in a 4-month trading range, there is an increased chance of disappointing follow-through tomorrow. That means there is an increased chance of a bear bar on the daily chart tomorrow.
- However, if the 5-day rally is actually a resumption of the 18-month bull trend, it can have many more bull bars.
- Traders should find out over the next week if the rally is just a buy vacuum test of the top of the 4-month trading range or a resumption of the bull trend.
See the weekly update for a discussion of the price action on the weekly chart and for what to expect going into next week.
Trading Room
Traders can see the end of the day bar-by-bar price action report by signing up for free at BrooksPriceAction.com. I talk about the detailed S&P Emini futures price action real-time throughout the day in the BrooksPriceAction.com trading room. We offer a 2 day free trial.
Charts use Pacific Time
When I mention time, it is USA Pacific Time. The Emini day session charts begin at 6:30 am PT and end at 1:15 pm PT which is 15 minutes after the NYSE closes. You can read background information on the market reports on the Market Update page.

