Emini bounce after wedge top and Trump’s tariffs
Updated 6:42 a.m.
On the open, the Emini reversed down from above yesterday’s high, last week’s buy climax high, and the top of the bull channel. Yet, the 1st bear bars have tails and the selloff did not break strongly below yesterday’s higher low. While this open is good for the bears, the odds are that it is a bear leg in what will become a trading range than a bear trend.
The bulls want an opening reversal up from the moving average. However, the early bear bars and yesterday’s broad channel make an early trading range likely. Even if the bulls get their reversal up, the odds are that today will evolve into a trading range within a couple of hours. It is now deciding if it has made the high. The low could be down near the 60 minute EMA. It is also at the beginning of yesterday’s bull channel.
Pre-Open market analysis
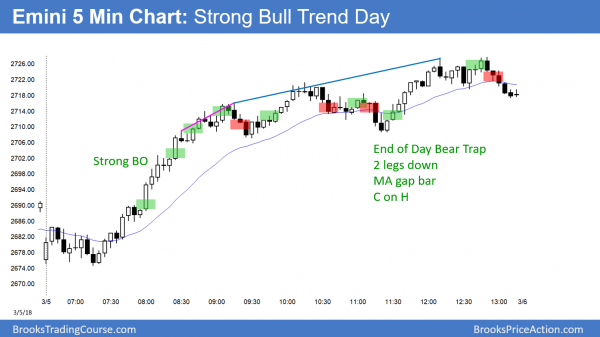
Yesterday rallied off the close of 2017. It broke strongly above Friday’s high, triggering a buy signal on the daily chart. However, there is a wedge top on the daily chart. Therefore, the odds favor a 2nd leg sideways to down after a 2 – 5 day rally.
The bulls also broke above the 60 minute moving average, Friday’s high, and the 2700 Big Round Number. However, the rally contained a series of buy climaxes. This will probably lead to exhaustion and a trading range early today.
Overnight Emini Globex trading
The Emini is up 9 points in the Globex market. However, the 2 day rally is now in the middle of its developing 2 month trading range on the daily chart. In addition, it is at the magnet of the 20 day EMA. Finally, yesterday’s series of buy climaxes probably will exhaust the bulls today.
There is a 50% chance of follow-through buying on the open. But, there is only a 25% chance of another strong bull trend day. Finally, there is a 75% chance of at least a couple hours of sideways to down trading beginning by the end of the 2nd hour. This is especially true since bears made money selling new highs for the entire 2nd half of yesterday. That is usually a sign that a bull trend will soon evolve into a trading range.
Yesterday’s setups
Here are several reasonable stop entry setups from yesterday. I sometimes also show limit order entries and entries on the close of bars.
EURUSD strong rally will probably stall today or tomorrow
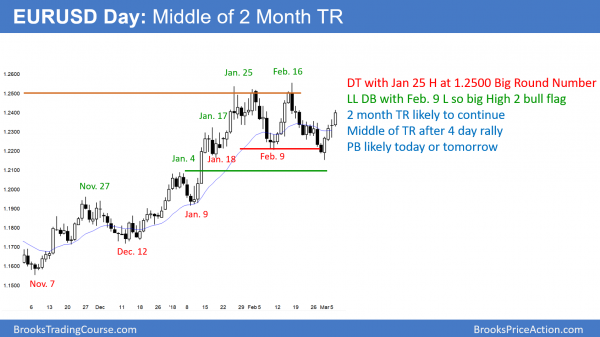
The EURUSD daily Forex chart rallied for 4 days after a failed breakout below the bottom of a 2 month trading range. While the rally is strong, it is now in the middle of the range.
After a 4 day rally to the middle of the 2 month trading range, the EURUSD daily Forex chart is likely to stall today or tomorrow. This is because markets tend to spend most of the time, when in trading ranges, in the middle of the range. Furthermore, they usually pull back after 4 – 6 days in a micro channel in a trading range.
While the overnight rally has been strong, today is now the 4th day in the rally. In addition, I have said several times that the rally would probably reach 1.24 and then stall. It is there now. If the bulls instead continue the rally tomorrow up to 1.25, the rally will become more likely a resumption of the bull trend than a bull leg in the 2 month range. Traders would then expect the rally to continue up to the next resistance at the monthly bear trend line above 1.26.
Weekly and monthly charts
Last week was a weak buy signal bar on the weekly chart. Therefore, by breaking above last week’s high yesterday, the bulls triggered a weak buy. A weak buy usually results in a continuation of the bull flag instead of a resumption of the bull trend. Consequently, this week will probably not be a big bull trend bar closing on its high. That would make it a strong entry bar for the break above bull flag. Hence, it would increase the odds of a new leg up.
In addition, the bulls need a strong break above 1.25 next week. Without that, the 2 month trading range will likely continue for at least a few more weeks.
However, the weekly chart is in a bull trend. When there finally is a breakout, up is more likely than down. This is especially true since there is a bear trend line on the monthly chart just above 1.26. A trend line is both resistance and a magnet.
Weekly bull flag
It is important to note that the 2 month bull flag has many bars with prominent tails. In addition, it is late in the bull trend. Also, it is at the top of a wedge rally on the monthly chart. Furthermore, a failed breakout above this bull flag would create a wedge top on the weekly chart.
Finally, that failed breakout would be a test of a bear trend line on the monthly chart just above 1.26. That is therefore a magnet and resistance. Consequently, the EURUSD Forex market will ultimately probably have a pullback lasting many months and 500 or more pips once the rally gets around 1.27.
Overnight EURUSD Forex trading
The EURUSD 5 minute Forex chart rallied 80 pips over the past 2 hours. It therefore has broken above last week’s 5 day bear flag. The momentum is strong enough to make at least one more small leg up likely.
Yet, it is now in the middle of the 2 month trading range. Markets tend to spend a lot of time in the middle of trading ranges. Consequently, this rally will probably stall today or tomorrow.
There was a big bull breakout 2 hours ago on the 60 minute chart. The EURUSD 5 minute chart is now in the middle of a 2 month trading range. There is at least a 40% chance that it will reverse down today or tomorrow for at least a couple of days. While the odds favor at least one more small leg up today, traders should also look for a possible short in the next 2 days for a 50+ pip swing down.
It is important to note that today’s range is already about the size of most big days over the past 2 months. That is an additional reason why there might not be much left to today’s rally.
Summary of today’s S&P Emini futures price action and what to expect tomorrow
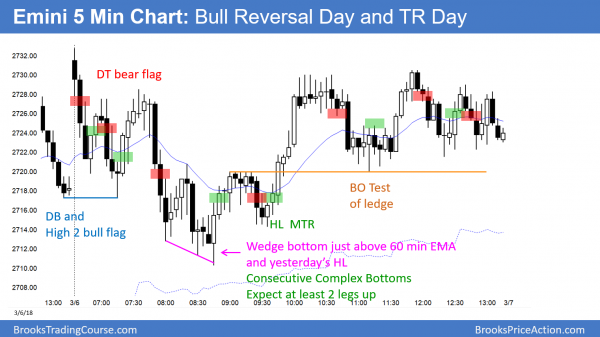
The bulls tried for a double bottom with yesterday’s higher low, but failed. They then got a wedge reversal up from the 60 minute moving average. Today was a bull reversal day and a trading range day.
Today was a pause day after 2 strong bull days. The 2 day rally was strong enough for a 2nd leg up. Yet, the wedge top on the daily chart will probably have a 2nd leg down after another day or two up. Traders will probably start to sell around 2750, which is a big round number and just above a measured move up on the 60 minute chart.
See the weekly update for a discussion of the price action on the weekly candlestick chart and for what to expect going into next week.
Traders can see the end of the day bar-by-bar price action report by signing up for free at BrooksPriceAction.com. I talk about the detailed S&P Emini futures price action real-time throughout the day in the BrooksPriceAction.com trading room. We offer a 2 day free trial.
When I mention time, it is USA Pacific Standard Time (the Emini day session opens at 6:30 am PST, and closes at 1:15 pm PST). You can read background information on the intraday market reports on the Intraday Market Update page.


