Emini bears want outside down candle stick on weekly chart
I will update again at the end of the day
Pre-Open market analysis
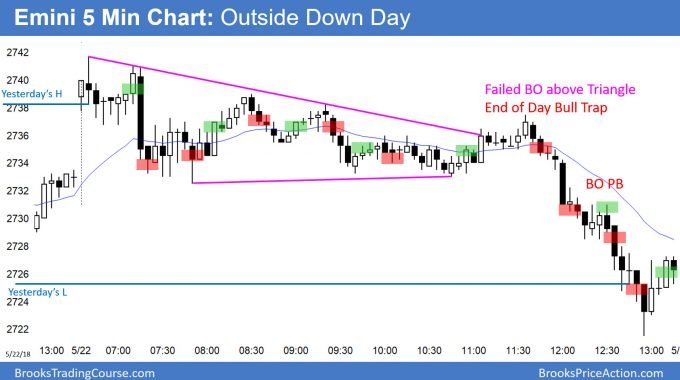
Yesterday reversed down from a breakout above last week’s high. It sold off strongly at the end of the day and formed an outside down day. Since last week was small, the Emini might trade below last week’s low this week. This would create an outside down week. Because the momentum down at the end of yesterday was strong and last week’s range was small, the odds are that this week will go outside down.
If this week is a big bear bar on the weekly chart, and it closes on its low and far below last week’s low, it would be a sign of strong bears. It would therefore increase the chance of a test of the February low. More likely, this week will not close far below last week’s low. If that is the case, the odds will still favor a gradual rally up to the all-time high.
Overnight Emini Globex trading
The Emini is down 17 points in the Globex session. It is therefore now only 9 points above last week’s low. The odds are that it will trade below last week’s low at some point this week. This week would then be an outside down week.
Last week’s low of 2700.50 is at the 2700 Big Round Number. This is support. Additionally, it is still around the support of the April 18 high of 2718. However, a strong break below last week’s low would trigger a small double top.
That breakout could lead to a quick 40 point measured move down. While this increases the odds of a big bear trend day, a test of support also increases the chance of a bull reversal. However, since most of the trading over the past 2 weeks has been in trading ranges on the 5 minute chart, that will likely be the case again today.
Today will open with a big gap down. That increases the chance of a trend day, and a bear trend is more likely. However, there is only a 20% chance of a big trend up or down on the open. Instead, there is usually a 3 – 10 bar move up or down and then a trading range for the 1st 1 – 2 hours. Once the chart gets close to the EMA, traders will look for either a reversal down into a bear trend or a break above and a bull trend.
Yesterday’s setups
Here are several reasonable stop entry setups from yesterday. I sometimes also show limit order entries and entries on the close of bars.
EURUSD Forex market in series of sell climaxes
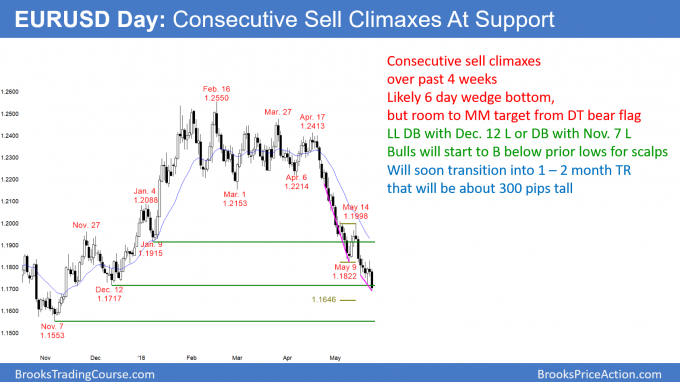
The EURUSD daily Forex chart has a big bear bar so far today. This is the 3rd push down in 6 days and therefore a likely parabolic wedge sell climax. There is room to the measured move target from the May 14 double top bear flag.
The EURUSD daily Forex chart sold off strongly again overnight. Every big bear bar or series of bear bars is a sell climax. After a parabolic wedge bottom on May 9, the bear trend resumed and now has 3 small pushes down. This is another parabolic wedge sell climax.
Today’s low so far is about 50 pips above the measured move target from the May 14 double top bear flag. There is a 60% chance of a minor reversal up from a measured move down from a double top bear flag. The minimum goal is TBTL Ten Bars and Two Legs up. Other targets are the 20 week EMA and the top of the sell climax at around 1.2000. The rally will be a bull leg in a trading range, which will probably last a couple months.
The bears want today to close below the May 9 low. That would create a gap between today’s close and the May 9 low. However, since this selloff is so extremely climactic and in a support zone around the December 12 and November 7 lows, the bears will probably be quick to take profits.
This will probably result in at least a small pullback above the May 9 breakout point. Since the bulls know this, they are probably buying here below the May 9 low for scalps. If there is a pullback above the May 9 low, they will make a profit. That would be an early sign that the strong bear trend is weakening and beginning to transition into a trading range.
Can the sell climax continue for several more weeks?
The bears want the daily chart to close below the May 9 low. That will create a gap between today’s close and that low. If the bears prevent a pullback above the May 9 low breakout point, that gap would then probably lead to a 300 pip measured move down to around 1.1400.
However, because of the consecutive sell climaxes, the bears are aware of the risk of a quick 200 – 300 pip reversal up coming at any time. This will make them take quick profits at the earliest sign of a reversal. It is therefore dangerous to sell a the bottom of a sell climax. Instead, the bears will begin to take profits at the lows and look to sell rallies.
Overnight EURUSD Forex trading
The EURUSD 5 minute Forex chart fell 100 pips in 3 legs overnight. This is wedge bear channel. Hence, the 5 minute chart will probably soon go sideways to slightly up today. Therefore, the bears will begin to sell 30 pips rallies and the bulls will buy reversals up from new lows for 10 – 20 pip scalps. Consequently, the chart will probably evolve into a 30 – 50 pip tall trading range this morning.
The 2nd leg down in the overnight wedge was very big. That probably reset the count. This means that it is now the 1st push down in a new wedge, and there will likely be one more minor new low this morning before there is a minor reversal up and then a trading range.
Summary of today’s S&P Emini futures price action and what to expect tomorrow
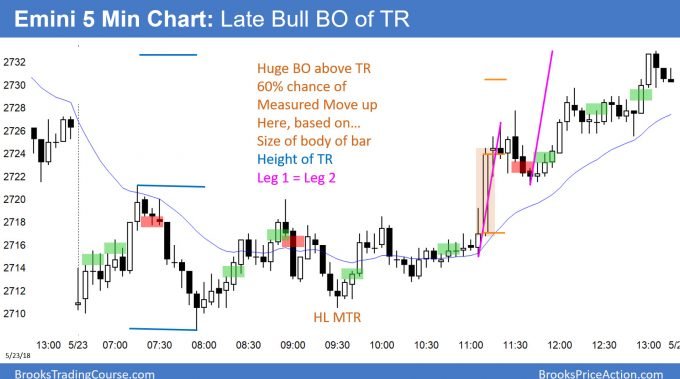
After gapping down, the Emini entered a trading range. There was a late bull breakout that closed the gap. The day was a bull trend day.
The Emini gapped down and entered a trading range. There was a late big bull reversal that closed the gap. Today is now a buy signal bar on the daily chart for a resumption of the bull trend that began on May 3.
However, the daily chart has been in a tight trading range for 2 weeks. Therefore, there is a 40% chance of a test of last week’s low before the bull trend resumes. Furthermore, there is also a 40% chance that there will be another test of the February low before there is a new high. The odds still favor the bulls, even if there is more of a pullback over the next few weeks.
See the weekly update for a discussion of the price action on the weekly candlestick chart and for what to expect going into next week.
Traders can see the end of the day bar-by-bar price action report by signing up for free at BrooksPriceAction.com. I talk about the detailed S&P Emini futures price action real-time throughout the day in the BrooksPriceAction.com trading room. We offer a 2 day free trial.
When I mention time, it is USA Pacific Standard Time (the Emini day session opens at 6:30 am PST, and closes at 1:15 pm PST). You can read background information on the intraday market reports on the Intraday Market Update page.


