Trading Update: Wednesday November 3, 2021
Emini pre-open market analysis
Emini daily chart
- November FOMC announcement today at 11:00 am PT.
- Emini at all-time high and in strong trend on daily, weekly, and monthly charts.
- Measured move target at 4642.50 based on September 23 neckline of September 20/October 4 double bottom.
- There are other higher targets, but too far to reach today.
- Because the bull trend is strong, traders will buy the next 1- to 3-day selloff.
- The bears will probably need a micro double top to get more than a brief pullback.
- Since the daily chart has gone up for a lot of days without more than a 1-day pullback, the rally is climactic. That usually leads to a trading range, which means a couple legs sideways to down. It should begin within a couple weeks.
- The Fed is in the process of changing its policy. That increases the chance of a surprise.
- A surprise can affect the market for a couple weeks. But, if the surprise is bearish, the best the bears will likely get is a trading range for a couple weeks.
Emini 5-minute chart and what to expect today
- Emini is down 6 points in the overnight Globex session. Today will probably open within yesterday’s trading range.
- That would increase the chance of it staying within the range going into today’s November FOMC announcement today at 11:00 am PT.
- Day traders should exit positions ahead of the report.
- There is usually a sharp move up and down in the 1st few minutes after the report. Day traders usually should wait until at least 10 minutes after the report before resuming trading.
- In only 20% of the time, the report leads to a strong trend up or down and lasting for the rest of the day.
- More often, even if there is a strong trend, there is usually an opposite swing before the close.
- Day traders should be open to anything after the report. That means a trend up or down, a trend that reverses, an initial strong brief move that reverses, or a trading range. Trade what is in front of you and not what you hope will appear.
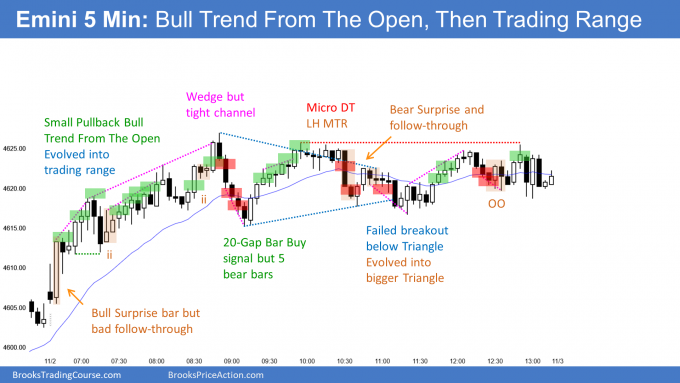
Yesterday’s Emini setups

Here are several reasonable stop entry setups from yesterday. I show each buy entry with a green rectangle and each sell entry with a red rectangle. Buyers of both the Brooks Trading Course and Encyclopedia of Chart Patterns have access to a much more detailed explanation of the swing trades for each day (see Online Course/BTC Daily Setups).
My goal with these charts is to present an Always In perspective. If a trader was trying to be Always In or nearly Always In a position all day, and he was not currently in the market, these entries would be logical times for him to enter. These therefore are swing entries.
It is important to understand that most swing setups do not lead to swing trades. As soon as traders are disappointed, many exit. Those who exit prefer to get out with a small profit (scalp), but often have to exit with a small loss.
If the risk is too big for your account, you should wait for trades with less risk or trade an alternative market like the Micro Emini.
EURUSD Forex market trading strategies
EURUSD Forex daily chart

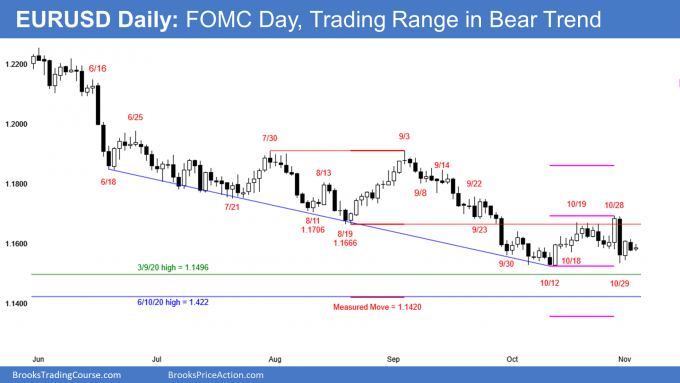
- Thursday was a big bull day and Friday was even a bigger bear day.
- Monday was a bull day closing near its high, and it was therefore bad follow-through for the bears.
- Furthermore, a strong as Friday’s selloff was, if failed to break below the October 10 low.
- Yesterday is a Low 1 sell signal bar. However, it is at the bottom of the 5-week trading range, which makes it less reliable.
- So far, today is a small inside bar. It has not yet triggered the sell signal.
- The bulls hope that today is a pullback from Monday’s reversal up.
- Reversals every day for 4 days.
- The daily chart has been in a trading range for 5 weeks. Traders have been betting on reversals.
- However, I have repeatedly talked about last year’s breakout points as magnets below. Those are the March 9, 2020 high just below 1.15 and the June 10, 2020 high just above 1.14.
- Since the EURUSD has been in a trading range for 7 years, the odds are that it will dip below at least one of those highs before the bulls will buy aggressively again.
- This is especially true after Friday’s strong reversal down, turning Thursday into a bull trap.
- However, the bulls might get a reversal up from a double bottom with the October 10 low.
- It is slightly more likely that the EURUSD will fall to at least 1.15 over the next few weeks before reversing up.
- Whether it does or not, it should soon reverse up to near the September 3 high over the following few months.
- The November FOMC announcement is at 11 am PT today. It will affect all financial markets. Day traders should exit positions ahead of the report and not look to resume day trading until at least 10 minutes afterwards.
Summary of today’s S&P Emini futures price action and what to expect tomorrow

End of day summary
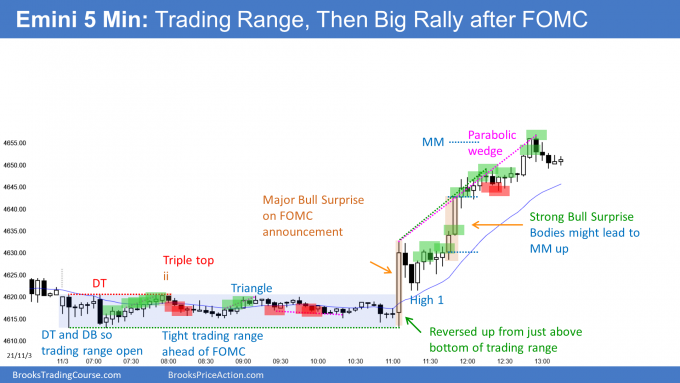
- Very tight trading range ahead of the FOMC announcement.
- Major Bull Surprise Bar on the report so should get either trading range or bull trend for rest of day.
- High 1 pullback and then 2 more strong legs up.
- Closed near the high so increased chance of gap up tomorrow, despite the buy climax on the daily chart.
- Today was a buy climax day so 75% chance of at least a couple legs sideways to down tomorrow, starting by the end of the 2nd hour.
- The bull trend on the daily chart is strong. Bulls will buy the 1st 1- to 3-day reversal down.
- Next target is top of weekly buy channel, which is around the 4800 measured move target, based on the summer trading range.
- The bears will probably need a micro double top before there is more than a 3-day pullback.
See the weekly update for a discussion of the price action on the weekly chart and for what to expect going into next week.
Trading Room
Traders can see the end of the day bar-by-bar price action report by signing up for free at BrooksPriceAction.com. I talk about the detailed S&P Emini futures price action real-time throughout the day in the BrooksPriceAction.com trading room. We offer a 2 day free trial.
Charts use Pacific Time
When I mention time, it is USA Pacific Time. The Emini day session charts begin at 6:30 am PT and end at 1:15 pm PT which is 15 minutes after the NYSE closes. You can read background information on the market reports on the Market Update page.

