Early Emini bear trend but April is seasonally bullish
Updated 6:55 a.m.
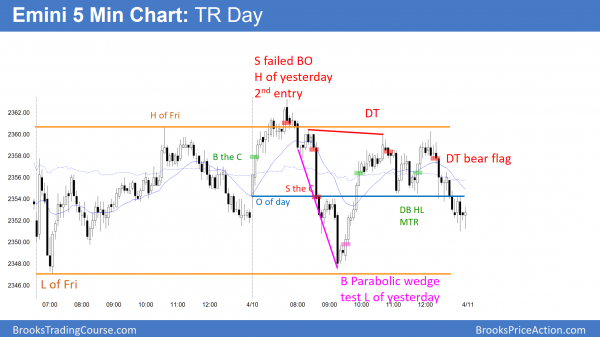
The Emini rallied on the open and is Always In Long. Yet, the bulls need a strong break above the 3 day tight trading range. Otherwise, this is just a rally in the range. Traders are now choosing between a bull trend day and a trading range day. If there is a deep pullback to the open of the day, the odds will favor a trading range day. If there is a strong breakout above Thursday’s high, today will probably be a bull trend day. Until there is a breakout, the odds favor a trading range day.
Because the rally was strong, the bears need at least a micro double top before traders will sell. While today could still be a bear trend day, that is unlikely. The best they probably will get is a trading range.
Pre-Open market analysis
The Emini is in the middle of a 2 week tight trading range. Furthermore, that range is in the middle of a 2 month range. Because the bears continue to fail to get follow-through selling, the Emini might rally to the March 15 lower high. Since there is no sign yet that the trading range is about to breakout, more trading range days are likely.
Yet, the weekly chart has a major buy climax. The odds are that any new high will be small. In addition, the weekly chart will probably correct down to below the weekly moving average. Consequently, the weak bear channel on the daily chart is probably the start of a 5% correction. The odds are better than 50%. But, if the bears get a big breakout with strong follow-through selling, they will create a measuring gap. The measured move target would be around the December close.
Overnight Emini Globex trading
The Emini is down 1 point in the Globex market. The bears see the two month trading range has an early reversal down from a lower high major trend reversal and a triangle. The lower highs mean that the daily chart is in an early bear trend.
The bulls see the trading range as a head and shoulders bull flag and triangle. Yet, the bears still have a stronger case because of what I wrote over the weekend about the weekly chart. While the odds favor a test of last week’s high and possibly the March 15 lower high over the next 2 week’s, the odds still favor a bear breakout below the March 27 major high low within a month.
Since the Emini has been in a tight trading range and 5 of the past 6 days have been dojis, the odds still favor more trading range days. This will probably be the case until there is a strong breakout above or below the 2 month range.
EURUSD Forex market trading strategies
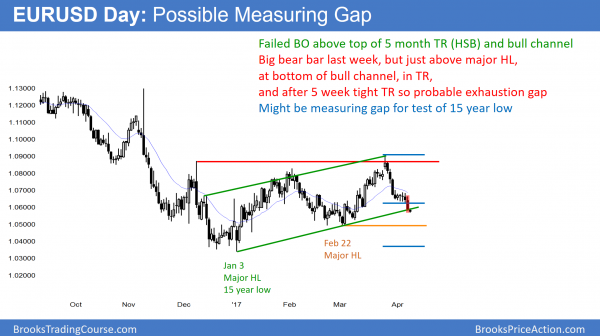
The daily EURUSD Forex chart had a big bear bar last week after a 5 week tight trading range. The bears want a measured move down, but the bulls want an exhaustion gap and reversal up.
The EURUSD daily Forex chart had a big bear bar last week after a 5 day tight trading range. In addition, the breakout was in the middle of a 6 month trading range. Furthermore, it is testing the bottom of a broad bull channel. Finally, it is testing the March 15 buy climax low. Consequently, the odds are that the gap between last week’s close and the small tight trading range will be an exhaustion gap.
Hence, it is likely that the EURUSD will rally above the April 4 tight trading range low within a week or two. The gap would therefore be an exhaustion gap.
Less likely, the gap will lead to a measured move down to the 15 year low. The bears need to keep the gap open. Furthermore, they need follow-through selling within the next 3 weeks. If they succeed, the EURUSD will probably fall to test the January 3 bottom of the 6 month trading range. That low is also the low of the past 15 years. If the bears break below it, and they probably will at some point this year, the next target is par (1.0000).
Overnight EURUSD Forex trading
The EURUSD Forex market has been in a 25 pip range overnight. Traders are deciding if Friday’s gap will remain open or close. In addition, the bulls are trying to find support at the bottom of the channel. They want a reversal back up from another higher low.
Most breakouts within trading ranges fail and reverse. While the 2 week selloff was strong, the odds still favor a continued trading range instead of a resumption of the monthly bear trend. Because the monthly chart is in a bear trend, the odds favor an eventual selloff to par.
Yet, since the daily chart has been in a trading range for 16 months, betting that any one selloff will be a resumption of the trend is a low probability bet. The odds are that all strong moves up and down will reverse, even though the odds are that one will eventually lead to a trend.
Hence, is is more likely that the 2 week selloff will prove to be just another leg in the trading range. Therefore, the odds are that the EURUSD chart will rally back into last week’s tight trading range before falling much further.
Because the bears will probably eventually win and last week is a possible measuring gap, traders should be ready to swing trade shorts if the selloff continues down relentlessly this week. That is less likely.
Summary of today’s S&P Emini futures price action and what to expect tomorrow
The Emini sold off to test Friday’s low, but reversed up from a parabolic wedge bottom. It was another trading range day in a tight trading range on the daily chart.
The daily chart has a tight trading range after the reversal up 2 weeks ago. While the odds are that the bear channel will continue down to the December close, the Emini might test the March 15 lower high first. The odds favor at least a small rally over the next week.
See the weekly update for a discussion of the price action on the weekly candlestick chart and for what to expect going into next week.
Traders can see the end of the day bar-by-bar price action report by signing up for free at BrooksPriceAction.com. I talk about the detailed S&P Emini futures price action real-time throughout the day in the BrooksPriceAction.com trading room. We offer a 2 day free trial.
When I mention time, it is USA Pacific Standard Time (the Emini day session opens at 6:30 am PST, and closes at 1:15 pm PST). You can read background information on the intraday market reports on the Intraday Market Update page.


