Breakout mode candlestick pattern
Updated 6:49 a.m.
The Emini opened within the trading range at the end of yesterday. Since yesterday was a Spike and Channel bear trend, the odds favor a rally above the lower highs, and possibly to the 2130 top of the bear channel. That is also at the 60 minute moving average.
The bears want a break below the 4 day range. Unless there is a strong break with follow-through, the odds favor a rally to resistance. Because of the 4 day trading range, the odds also favor a lot of trading range price action again today. Furthermore, today’s early reversals and next week’s FOMC uncertainty also increase the chances of trading range price action. This means that the odds are that there will be at least one swing up and one swing down today. Moreover, it makes a strong trend day less likely.
The Emini is having a limit order open. While the location is good for the bulls, and the odds favor a test up after yesterday’s Spike and Channel Bear Trend, there is a 70% chance of a drop below 2084.50 within the next couple of weeks, and it can happen at any time. This uncertainty and the shrinking range over the past few days make a trading range day likely.
Pre-Open Market Analysis
Yesterday was another sideways bar on the daily chart. It reversed up from 1 tick below the prior day’s low and therefore almost formed an ii pattern. Furthermore, yesterday was the 4th bar in a developing tight trading range. While normally the odds for the bulls and bears are 50%, this case is different. Because there is a 70% chance that the gap above the 2 year trading range will close before there is a new all-time high, and because there is a bull trend line around that price, the odds favor a test of that support.
Yet, the momentum is up strongly on the monthly chart. Therefore the odds are that bulls will buy this pullback. Hence, the odds favor a new all-time high after the current pullback ends.
Emini Globex Session
The Emini is up 10 points in the Globex session. Yesterday was a bear channel and therefore a bull flag. Today will probably open above the bull flag. Furthermore, yesterday was a triple bottom test of Monday’s low. After 4 big days with big reversals, the Emini remains in breakout mode. It is trying to find a neutral price before next week’s FOMC meeting. The bulls need to do more to negate Friday’s strong selloff. The daily chart is still likely to fall the July 2015 high of 2084.50 before resuming up to a new high.
Forex: Best trading strategies
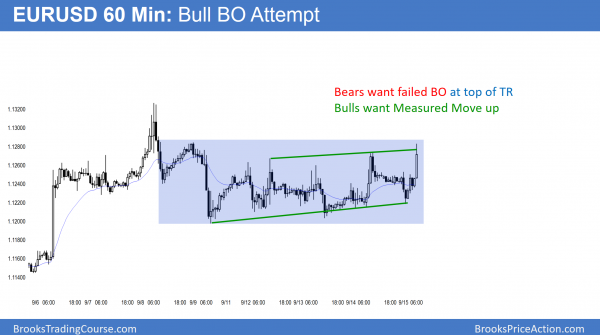
The 60 minute chart has been in a bull flag for 5 days. However, the September 8 rally was a buy climax and it therefore might lead to a reversal down. The bulls are trying for trend resumption up today.
The EURUSD daily Forex chart has been sideways for 7 days, and in a bull flag for 5 days. Although the bulls got a breakout yesterday, it was small and the follow-through was weak. While the bulls are slightly more in control, the tight trading range means that it is still mostly neutral. It is in the middle of nested head and shoulders tops on the 60 minute and daily charts, and at the apex of a triangle. Consequently, it is in breakout mode, and traders might be waiting for next week’s Fed announcement before deciding on the breakout.
Summary of today’s S&P Emini futures price action and what to expect tomorrow
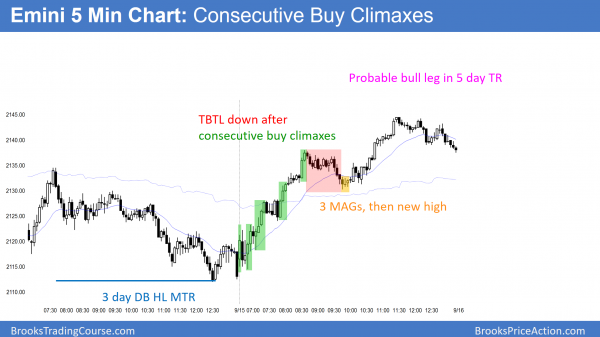
The Emini reversed up from a 3 day higher low major trend reversal. After a series of consecutive buy climaxes, it pulled back for a couple of legs. It had 3 Moving Average Gap Bars (gap between the high and the moving average) that led to a new high of the day.
The Emini reversed up from a 3 day double bottom major trend reversal. Yet the odds still favor a 2nd leg down to below the 2084.50 July 2015 high before a new all-time high. However, if the Emini continues up for another day or two, the odds will favor the bulls.
Because Moving Average Gap Bars usually lead to the final bull leg before a major trend reversal attempts, traders will look for a possible sell setup early tomorrow.
See the weekly update for a discussion of the price action on the weekly candlestick chart and for what to expect going into next week.
Traders can see the end of the day bar-by-bar price action report by signing up for free at BrooksPriceAction.com. I talk about the detailed S&P Emini futures price action real-time throughout the day in the BrooksPriceAction.com trading room. We offer a 2 day free trial.
When I mention time, it is USA Pacific Standard Time (the Emini day session opens at 6:30 am PST, and closes at 1:15 pm PST). You can read background information on the intraday market reports on the Intraday Market Update page.


