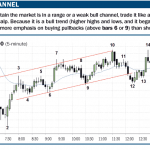
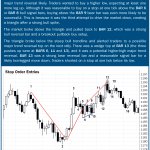
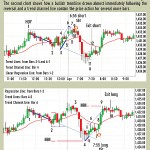
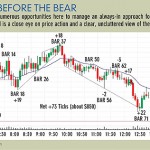
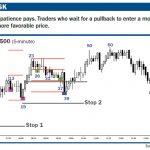
Markets are either in trends or trading ranges, and trends can be strong or weak. When they are strong, the market is moving clearly and quickly to a new price. There are several large trend bars or a series of ordinary trend bars, and there is little overlap between adjacent bars. This is the spike […]
Trading price action in treasury bond futures
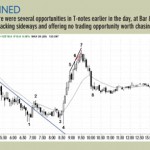
Once you achieve an understanding of price action dynamics, all you need to trade successfully is a five-minute chart and a 20-bar exponential moving average (EMA). This works for scalping trades in the E-mini S&P 500, but also stocks and options for intraday and daily swings. It’s also quite effective in 10-year Treasury notes (TY). […]
Trade the S&P with price action fundamentals
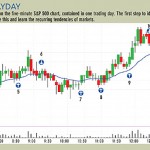
Price action fundamentals in the S&P The term price action is vague and means different things to different people. The broadest definition refers to any representation on a chart of any aspect of price movement during the course of trading. This includes any financial instrument, on any type of chart, in any time frame. Most […]
Learn to trade final flags for Emini success
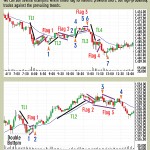
A five-minute E-mini S&P 500 chart provides an incredible amount of information. But despite this massive flow of information, simple analysis of its price action is all that is needed to trade successfully. One such strategy is based on flag formations, and a final flag usually presents several profitable entries every day. A flag formation […]
Learn how to trade: predicting trend reversals
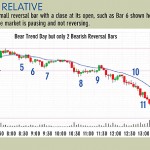
Learning how to trade Emini S&P trend reversals is time well spent. A reversal bar on a candlestick chart is any bar with a tail on one end and its close near the other end. A bullish reversal bar has a close near its high, and a bearish reversal bar has a close near its […]
Learn how to trade Emini wedges
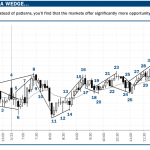
You can learn to trade more subtle wedges in the S&P Emini giving you more setups to look for. A wedge reversal pattern occurs when the market makes three pushes in either a rising or falling convergent triangular pattern. However, if you are a little flexible with how you define a wedge, you will discover […]
Learn how to trade emini breakouts on the 5 minute Emini chart
Trading the Emini S&P 500 day session, there are 81 bars on the five-minute chart, and most go above the high or below the low of the prior bar. Each instance is an Emini breakout and, as with all breakouts, there is an opportunity to make money. In a market as large as the Emini, […]
Trading price action of Emini channel lines
You learn a lot about what doesn’t work day-trading the S&P market for two decades, but luckily, if you don’t try to get too complex, you also can stumble upon a setup or two that work quite well. Once such technique is based on price action around easily identifiable support and resistance levels…channel lines in […]
How to trade using the Always In swing trading approach
Most traders don’t have the temperament to watch every tick of the market, finding it more profitable to specialize in intraday swing trading. You can trade successfully with just a five-minute chart and a 20-bar exponential moving average (EMA). If you aren’t greedy and if you have patience, you don’t need to process a slate […]
Learn how to scale into trends with price action trading
Beating uncertainty by scaling into trends Look at the volume of any bar on a chart. You will notice that it is about the same on bars that, with hindsight, are obvious buy or sell signals. Casual observers might ask how that can be. Doesn’t everyone enter on these clear-cut setups? The reason volume stays […]
