Posted 7:00 a.m. The day began with a tight trading range at yesterday’s low. The bulls were hoping for a wedge bottom, and the bears wanted an opening reversal down from the moving average. Several days last week had a similar open. When the Emini looks like this, traders are hesitant to swing trade until […]
Intraday market update, February 9, 2015:
Foreign currency exchange trade of the week, February 7, 2015:
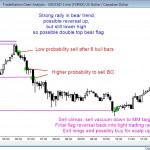
Forex double top bear flag
Example of foreign currency exchange trade of the week: Forex double top bear flag in USDCAD 5 minute chart The 5 minute Forex USDCAD candle chart had a strong rally, but failed to get above the prior lower high. This trapped bulls into buying high and bears into waiting to short. The 5 minute Forex […]
Emini weekend update: February 7, 2015:
Breakout of a small monthly bull flag
Monthly S&P500 Emini candle chart: Breakout of a small monthly bull flag The monthly Emini candle chart triggered a sell this week by falling below last month’s low, but the stops for the bears were hit on Friday when the Emini reversed back above last month’s high. As it did so, it triggered a small […]
Intraday market update, February 6, 2015:
Bull breakout of the trading range
Posted 7:01 a.m. The Emini broke out above the month long trading range and has found sellers. The 3rd bar of the day was a credible sell signal bar and put the market always in short for a failed breakout above the 5 minute bull channel and yesterday’s high, and a failed breakout above the […]
Intraday market update, February 5, 2015:
Testing the top of the trading range
Posted 7:05 a.m. The Emini reversed down from yesterday’s high, triggering an expanding triangle top, but this followed 4 consecutive bull bars so the odds favor buyers below the sell signal bar and at least one more push up. The bears will get higher probability if they wait for a strong reversal down or for […]
Intraday market update, February 4, 2015:
Bull trend within a trading range
Posted 7:00 a.m. Yesterday ended with a bull trend, but there were many dojis. That two sided price action continued today, and the Emini opened with a limit order market. Experienced traders are scalping with limit orders, but most traders should wait. It is still always in long, but it is in the middle of […]
Intraday market update, February 3, 2015:
Bull trend reversal or a pullback from the breakout
Posted 6:50 a.m. The Emini opened with a big gap up and a big bull trend bar. This is another buy climax and it follows several yesterday. When the market has a series of buy climaxes and is far above the moving average, its initial upside is usually limited to 5 – 10 bars before […]
Intraday market update, February 2, 2015:
Sell signal on the monthly candle chart
Posted 7:07 a.m. Since yesterday ended with consecutive sell climaxes, the odds are that there will at least a 2 hour trading range or rally at some point after the initial selling. The bears got an opening reversal down from the moving average and a breakout below last month’s low. This was the monthly sell […]
Emini weekend update: January 31, 2015:
Sell signal bar on the monthly candle chart
Monthly S&P500 Emini candle chart: Sell signal bar in overbought bull trend The monthly Emini candle chart formed an ioi setup with this month’s close on Friday. Since the monthly candle chart is overbought and at the top of the channel, this bear signal bar increases the chances of a profitable short on a breakout […]
Intraday market update, January 30, 2015:
Buy climax yesterday so a pullback today is likely
Posted 6:50 a.m. The Emini opened with a big gap down. Big up yesterday, big down today means big confusion and increases the chances of a trading range. The second and fourth bars were bear bars. This is bad follow-through after the strong bull bars, and that increases the chances of a trading range. Yesterday […]


