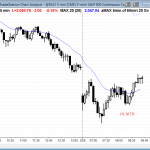
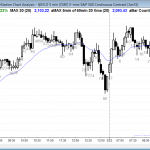
Monthly S&P500 Emini candle chart: Bear inside bar in a buy climax The monthly Emini candle chart is forming a bear inside bar after an outside bar. This ioi is a breakout mode setup. The monthly S&P500 Emini candle chart is extremely overbought, and this ioi pattern is a potential top. There are 2 trading […]
Emini weekend update: March 28, 2015:
Intraday market update, March 27, 2015:
Double bottom and a double top
Posted 6:57 a.m. I will here for only the first 2 hours today, but I will be home on Monday and will be here all day again. The Emini opened with a tight trading range within yesterday’s 5 hour trading range. It is in breakout mode. There have been many breakouts over the past 5 […]
Intraday market update, March 26, 2015:
Sell climax in a bear trend
Poster 6:49 a.m. Yesterday’s low tested the bottom of the wedge channel that began on March 18. The FOMC rally was the 2nd leg up in the wedge. Traders learning to trade the markets know that wedge trend reversals typically have at least 2 legs down, and the first leg often ends at the bottom […]
Intraday market update, March 25, 2015:
Bear trend day
I am traveling today and was unable to post, but I will post tomorrow, Thursday, and Friday. The Emini sold off strongly today and is deciding whether the 20% correction has begun, or instead if it is forming a triangle on the daily chart for one more new high before the correction begins. The month […]
Intraday market update, March 24, 2015:
Trading range after a buy climax
Posted 7:00 a.m. I am only here for the first 2 hours today, Thursday, and Friday, and I will not be here tomorrow, Wednesday. Yesterday was a bear reversal day on the daily chart and a sell setup for a lower high major trend reversal. When the Emini traded below yesterday’s low, it triggered the […]
Intraday market update, March 23, 2015:
Trading range after a strong breakout
I will post around 6:53 a.m. The Emini opened with 3 consecutive strong bull bars and therefore was always in long. It is also reversing up from a wedge bull flag at the end of Friday. Friday’s rally was strong enough to have follow-through today. However, if it does, this could result in a wedge […]
Emini weekend update: March 20, 2015:
Bull breakout but it might reverse
Monthly S&P500 Emini candle chart: Tight bull channel, but buy climax The monthly Emini candle chart is still in a bull trend, and this month is still forming an ioi breakout mode setup. The 60 minute chart is strongly up, which could make this month’s high go above last month’s high. The monthly S&P500 Emini […]
Intraday market update, March 20, 2015:
Bull trend resumption
Posted 7:05 a.m. The Emini is always in long and has a big gap up, but it is far above the moving average and in a tight trading range. Traders should wait for a good signal bar and good context. This is a limit order market so far and most traders should wait. This might […]
Intraday market update, March 19, 2015:
Pullback after a buy climax
Posted 7:02 a.m. The Emini opened with quiet trading, which was likely after yesterday’s buy climax. The pullback began in the final hour yesterday, and the bulls see this as a pullback after an overdone rally. The bears are hoping that the rally was the 3rd push up on the 60 minute chart and a […]
Intraday market update, March 18, 2015:
ABC bear flag
Posted 7:05 a.m. The Emini gapped down, but had trading range bars on the selloff to test yesterday’s low. The bears got a breakout below yesterday’s low to trigger the low 2 short on the daily chart, but the follow-through has been weak. This makes the selloff more likely a bear leg in what will […]


