Trading Update: Monday November 6, 2023 S&P Emini pre-open market analysis Emini daily chart Emini 5-minute chart and what to expect today Emini intraday market update Friday’s Emini setups Al created the SP500 Emini charts. Here are reasonable stop entry setups from Friday. I show each buy entry bar with a green arrow and each […]
Emini Climactic Reversal
Market Overview: S&P 500 Emini Futures The weekly chart formed an Emini climactic reversal reversing half of the whole move down within a week. The bulls need to create follow-through buying next week to increase the odds of higher prices. The bears hope that this week was simply a 50% pullback and wants a larger […]
Crude Oil Two-Legged Pullback
Market Overview: Crude Oil Futures The weekly chart formed a Crude Oil two-legged pullback, closing below the 20-week EMA. The bears need to create follow-through selling below the 20-week EMA to increase the odds of a reversal lower. The bulls want a reversal up from a double bottom bull flag (Oct 6 and Nov 3). […]
EURUSD Double Bottom Bull Flag
Market Overview: EURUSD Forex The monthly chart could be forming a EURUSD double bottom bull flag (Jan 6 and Oct 3). The bulls want November to be a bull bar closing near its high. The bears will need to create a breakout below the trading range low with follow-selling to increase the odds of a […]
Bitcoin en octubre: Buena vela alcista en $35k
Visión de Mercados: Futuros sobre Bitcoin Bitcoin ha formado una buena vela en octubre. Durante el mes de octubre, el precio ha aumentado su valor un 28.80 %, formando una vela de ruptura alcista que está rompiendo al alza un patrón de modo de ruptura. Si miramos a la izquierda del gráfico, el contexto es […]
Nifty 50 Wedge Top
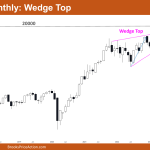
Market Overview: Nifty 50 Futures Nifty 50 Wedge Top on the monthly chart. The market continued to be in a wedge top breakout mode even after it provided a bear close for the October monthly bar. The big round number 20000 represents a strong resistance on the monthly chart that the Nifty 50 is trading […]
FTSE 100 Broad Bull Channel, Wedge, BOM at MA
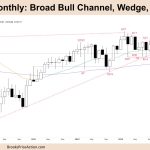
Market Overview: FTSE 100 Futures The FTSE futures market pulled back to below the MA in a broad bull channel. Its breakout mode, and maybe 3 pushes down after a bull spike. Traders bought the High 2 buy setup at the 100-month MA, selling above the high of the COVID crash. Longer-term buyers are probably waiting […]
DAX 40 Bear Spike, Breaking Swing Low, TR
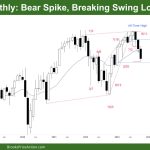
Market Overview: DAX 40 Futures DAX futures printed 3 bear bars on the monthly chart, a bear spike, for the first time since 2019. When the market has a moment of clarity, it usually pulls back. When it doesn’t, it creates a magnet to test later. We’re low in a tight bull channel, so traders […]
Nasdaq 100 Bear Bar Closing Below September Low
Market Overview: NASDAQ 100 Emini Futures The NASDAQ Emini futures October monthly Nasdaq Emini candlestick is a bear bar closing below September low with tails above and below. The week is a big trend bull bar closing back above the exponential moving average (EMA) and essentially reversing the bear bars of the last two weeks. The year […]
Emini Daily Chart Becoming Climactic
Trading Update: Friday November 3, 2023 S&P Emini pre-open market analysis Emini daily chart Emini 5-minute chart and what to expect today Yesterday’s Emini setups Al created the SP500 Emini charts. Here are reasonable stop entry setups from yesterday. I show each buy entry bar with a green arrow and each sell entry bar with […]
