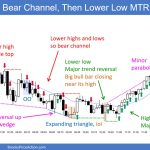
Trading Update: Monday December 4, 2023 S&P Emini pre-open market analysis Emini daily chart Emini 5-minute chart and what to expect today Friday’s Emini setups Al created the SP500 Emini charts. Here are reasonable stop entry setups from Friday. I show each buy entry bar with a green arrow and each sell entry bar with […]
Crude Oil Double Top Bear Flag
Market Overview: Crude Oil Futures The market formed a Crude Oil double top bear flag on the Monthly chart. The bears need to create a follow-through bear bar following the close below the 20-month EMA in November. The bulls want the 20-month EMA or the bull trend line to act as support and a reversal […]
EURUSD Bull Flag
Market Overview: EURUSD Forex The market formed a EURUSD bull flag (double bottom bull flag – Jan 6 and Oct 3) on the Monthly chart. The bulls need to create follow-through buying in December to increase the odds of retesting the July high. The bears hope that the current move is simply a deep pullback […]
Emini Strong Reversal
Market Overview: S&P 500 Emini Futures The market formed an Emini strong reversal on the Monthly chart, reversing the majority of the selloff of the prior 3 months. The next targets for the bulls are the July 27 high and the all-time high. The bears see the current rally as a retest of the July […]
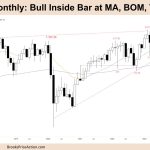
FTSE 100 Bull Inside Bar at MA, BOM, Trendline
Market Overview: FTSE 100 Futures FTSE 100 futures was a bull inside bar on the monthly chart. Inside bars, MA, triangles, think breakout mode (BOM) and sit on the hands until a clear entry sets up. Bulls might have a High 2 above the MA, but the bear channel is tight, and the first reversal […]
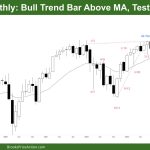
DAX 40 Bull Trend Bar above MA, Test Highs
Market Overview: DAX 40 Futures DAX futures had a bull trend bar last month, closing on its high. It is a buy signal for next month, but the 1:1 target would be a new ATH. It is also reasonable that if we get up to the high of that sell climax, those 3 bear bars, […]
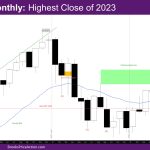
Nasdaq 100 Highest Close of 2023
Market Overview: NASDAQ 100 Emini Futures The NASDAQ Emini futures November monthly candlestick is a big bull trend bar with a small tail above. It is the highest close of 2023 closing just below the July 2023 high. The week is a doji bull outside bar (OB) going below and above last week. NASDAQ 100 Emini […]
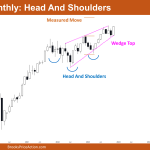
Nifty 50 Head And Shoulders
Market Overview: Nifty 50 Futures Nifty 50 Head and Shoulders on the monthly chart. The Nifty 50 made a strong bull bar and closed close to its high this month. It is currently trading close to the wedge-top pattern’s top. Bulls may expect this trend to continue until the measured move is reached, as the Nifty […]
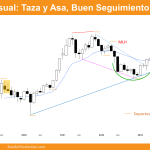
Bitcoin Taza y Asa: Buen seguimiento Alcista en los 40K.
Visión de Mercados: Futuros sobre Bitcoin Bitcoin gráfico mensual: El precio ha creado un buen seguimiento alcista tras una buena vela alcista en noviembre, que sucede la señal de compra de octubre. Durante el mes de noviembre, el precio ha aumentado su valor un 9.40 %. Tras el patrón de Taza y Asa y la […]
Emini High 1 Buy Signal Bar at Resistance
Trading Update: Friday December 1, 2023 S&P Emini pre-open market analysis Emini daily chart Emini 5-minute chart and what to expect today Yesterday’s Emini setups Al created the SP500 Emini charts. Here are reasonable stop entry setups from yesterday. I show each buy entry bar with a green arrow and each sell entry bar with […]
