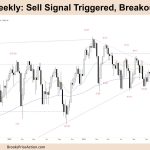
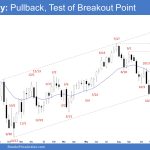
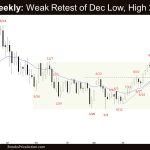
Market Overview: FTSE 100 Futures FTSE 100 futures moved lower last week, triggering a sell signal. The bulls got a streak out of the apex of a triangle, and we expected a test back down to the BO point. We touched the channel line again, and bulls need to create buying pressure here again to […]
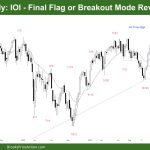
DAX 40 IOI – Final Flag or Breakout Mode Reversal
Market Overview: DAX 40 Futures DAX futures went sideways last week with an inside-outside-inside pattern (ioi.) The bulls see a final flag before one more leg up. The bears see a parabolic wedge, a tight channel up at the top of an expanding triangle. No good signals in 5 bars is TR price action, so […]
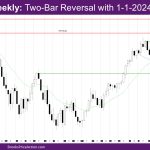
Nasdaq 100 Two-Bar Reversal with 1-1-2024?
Market Overview: NASDAQ 100 Emini Futures The NASDAQ Emini futures week is a big bull trend bar with a small tail above and below. It could be a two-bar reversal with 1-1-2024 – Its body overlaps with the body of week of 1-1-2024. This week went above last week’s high and closed slightly below last […]
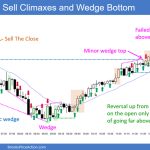
Emini Bulls Disappointed after Rally
Trading Update: Friday January 12, 2024 S&P Emini pre-open market analysis Emini daily chart Emini 5-minute chart and what to expect today Yesterday’s Emini setups Al created the SP500 Emini chart. Here are reasonable stop entry setups from yesterday. I show each buy entry bar with a green arrow and each sell entry bar with […]
Emini Testing the December 20th high
Trading Update: Thursday January 11, 2024 S&P Emini pre-open market analysis Emini daily chart Emini 5-minute chart and what to expect today Yesterday’s Emini setups Al created the SP500 Emini charts. Here are reasonable stop entry setups from yesterday. I show each buy entry bar with a green arrow and each sell entry bar with […]
Emini Disappointing Follow-through
Trading Update: Wednesday January 10, 2024 S&P Emini pre-open market analysis Emini daily chart Emini 5-minute chart and what to expect today Yesterday’s Emini setups Al created the SP500 Emini charts. Here are reasonable stop entry setups from yesterday. I show each buy entry bar with a green arrow and each sell entry bar with […]
Emini Disappointing Follow-through Likely
Trading Update: Tuesday January 9, 2024 S&P Emini pre-open market analysis Emini daily chart Emini 5-minute chart and what to expect today Yesterday’s Emini setups Al created the SP500 Emini charts. Here are reasonable stop entry setups from yesterday. I show each buy entry bar with a green arrow and each sell entry bar with […]
Emini Bulls Expecting Bounce
Trading Update: Monday January 8, 2024 S&P Emini pre-open market analysis Emini daily chart Emini 5-minute chart and what to expect today Friday’s Emini setups Al created the SP500 Emini charts. Here are reasonable stop entry setups from Friday. I show each buy entry bar with a green arrow and each sell entry bar with […]
Emini Start of Pullback
Market Overview: S&P 500 Emini Futures The market formed an Emini start of PB (pullback) following a climactic rally, ending the 10-bar bull microchannel streak. The bulls want the pullback to be sideways and shallow (with doji(s), bull bars and overlapping candlesticks), possibly forming a double bottom bull flag. The bears will need to create […]
Crude Oil Sideways to Up
Market Overview: Crude Oil Futures The market is forming a Crude Oil sideways to up pullback on the weekly chart. The bulls will need to create follow-through buying trading above the 20-week EMA to increase the odds of higher prices. The bears want the 20-week EMA and the bear trend line to act as resistance, forming […]
