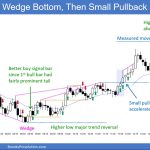
Trading Update: Wednesday January 24, 2024 S&P Emini pre-open market analysis Emini daily chart Emini 5-minute chart and what to expect today Yesterday’s Emini setups Al created the SP500 Emini charts. Here are reasonable stop entry setups from yesterday. I show each buy entry bar with a green arrow and each sell entry bar with […]
Emini Buyers below Yesterday’s Low
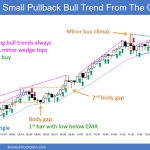
Trading Update: Tuesday January 23, 2024 S&P Emini pre-open market analysis Emini daily chart Emini 5-minute chart and what to expect today Yesterday’s Emini setups Al created the SP500 Emini charts. Here are reasonable stop entry setups from yesterday. I show each buy entry bar with a green arrow and each sell entry bar with […]
Emini Upside Breakout Likely to Get Second Leg
Trading Update: Monday January 22, 2024 S&P Emini pre-open market analysis Emini daily chart Emini 5-minute chart and what to expect today Friday’s Emini setups Al created the SP500 Emini charts. Here are reasonable stop entry setups from Friday. I show each buy entry bar with a green arrow and each sell entry bar with […]
Emini Breakout above the Dec 28 high
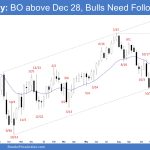
Market Overview: S&P 500 Emini Futures The weekly chart: The Emini breakout above the Dec 28 high and the bulls need follow-through buying to increase the odds of a retest of the all-time high. The bears want the Emini to stall around the December 28 high area or the trend channel line area. S&P500 Emini […]
Crude Oil Sideways Trading Range
Market Overview: Crude Oil Futures The weekly chart formed a Crude Oil sideways trading range with overlapping bars. The bulls will need to create follow-through buying trading above the 20-week EMA to increase the odds of the bull leg beginning. The bears want another leg down to retest the prior leg low (Dec 13) and […]
EURUSD Tested the 20-Week EMA
Market Overview: EURUSD Forex The weekly chart: the EURUSD tested the 20-week EMA in a two-legged pullback. The bears need to create a few strong consecutive bear bars closing below the 20-week EMA to increase the odds of retesting the trading range low. The bulls want the 20-week EMA to act as support, followed by a […]
Bitcoin Doji como Seguimiento tras Vela de Giro Bajista
Visión del mercado La semana pasada, Bitcoin cerró con una Vela Bajista de Giro. La Vela que la sucede, en el momento de redactar este informe, adopta la forma de una vela doji, cerrando por encima de los mínimos de las semanas previas. Los Traders, atentos a cada movimiento, aguardan con expectación Dos Patas Lateral […]
Nifty 50 at Big Round Number
Market Overview: Nifty 50 Futures Nifty 50 Big Round Number on the weekly chart. On the weekly chart, a notable event unfolded as the market formed another outside bar pattern, hinting at a potential increase in trading range price action. Despite a weak bear close this week, it is insufficient to reverse the prevailing strong […]
FTSE 100 Triangle, Bull Breakout Test of 100-Week MA
Market Overview: FTSE 100 Futures FTSE 100 futures moved lower last week back top test the apex of the triangle and the 100-week moving average (MA.) Deep pullbacks, disappointment and strong near the extremes. Trading range price action. That could lead to buyers here, as buying this MA has been a good trade historically. FTSE […]
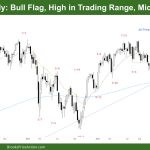
DAX 40 Bull Flag, High in Trading Range, Micro Wedge
Market Overview: DAX 40 Futures DAX futures moved lower last week in a bull flag with a bear doji. Sideways price action after a big move up. Price had a hard time getting through 17000 last time. The bulls want a good double bottom here to move higher. It’s still above the 200, so most […]
