Trading Update: Thursday February 15, 2024 S&P Emini pre-open market analysis Emini daily chart Emini 5-minute chart and what to expect today Yesterday’s Emini setups Al created the SP500 Emini charts. Here are reasonable stop entry setups from yesterday. I show each buy entry bar with a green arrow and each sell entry bar with […]
Emini Reached 5,000 and Moving Average Yesterday
Trading Update: Wednesday February 14, 2024 S&P Emini pre-open market analysis Emini daily chart Emini 5-minute chart and what to expect today Yesterday’s Emini setups Al created the SP500 Emini charts. Here are reasonable stop entry setups from yesterday. I show each buy entry bar with a green arrow and each sell entry bar with […]
Emini Climactic Rally Test of 5,000
Trading Update: Tuesday February 13, 2024 S&P Emini pre-open market analysis Emini daily chart Emini 5-minute chart and what to expect today Yesterday’s Emini setups Al created the SP500 Emini charts. Here are reasonable stop entry setups from yesterday. I show each buy entry bar with a green arrow and each sell entry bar with […]
Emini Far from Moving Average and 5,000 Round Number
Trading Update: Monday February 12, 2024 End of day video review S&P Emini pre-open market analysis Emini daily chart Emini 5-minute chart and what to expect today Friday’s Emini setups Al created the SP500 Emini charts. Here are reasonable stop entry setups from Friday. I show each buy entry bar with a green arrow and […]
Emini Parabolic Wedge
Market Overview: S&P 500 Emini Futures The weekly chart is in a tight bull channel which means strong bull, but it is also forming an Emini parabolic wedge (Nov 22, Dec 28, and Feb 9). The bulls need to continue creating follow-through buying above the all-time high. The bears want a reversal from a double […]
Crude Oil Overlapping Candlesticks
Market Overview: Crude Oil Futures Traders see Crude Oil Overlapping Candlesticks on the weekly chart which means the market is forming a tight trading range. The bulls will need to create sustained follow-through buying above the 20-day EMA and the bear trend line to increase the odds of the bull leg beginning. If the market […]
EURUSD Weak High 2 Setup
Market Overview: EURUSD Forex The weekly chart formed a EURUSD weak High 2 setup because it is following a tight bear channel. The bulls want a reversal from a double bottom bull flag (Dec 8 and Feb 6). The bears want a retest of the Feb 6 low followed by a breakout below. EURUSD Forex […]
Bitcoin gran vela alcista pero modo de ruptura en resistencia
Visión del mercado En nuestro último informe semanal de Bitcoin, destacamos la expectativa de una pata bajista. Sin embargo, el escenario ha experimentado un giro esta semana tras la aparición de una sólida vela de ruptura alcista. Este cambio plantea interrogantes sobre la dirección futura del mercado y nos lleva a revisar nuestras perspectivas previas. […]
Nifty 50 Bull Flag
Market Overview: Nifty 50 Futures Nifty 50 Bull Flag on the weekly chart. On the weekly chart, Nifty 50 closed weakly bearish this week, with a small-bodied bear bar and tails on both sides. Currently, the market is ensconced within a triangle, which, given its formation within a bull trend, can also be termed a […]
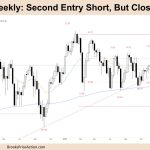
FTSE 100 Second Entry Short, But Closing on MA
Market Overview: FTSE 100 Futures FTSE 100 futures moved lower last week with a bear outside down bar, a second entry short in a trading range. It’s a broad bull channel, and so bulls and bears can make money. Neither side is trapped yet, so we are sitting between 7000 and 8000. I prefer to […]
