Market Overview: EURUSD Forex The monthly chart formed a EURUSD doji in the middle of the trading range and at the 20-month EMA. The bulls want the 20-month EMA to act as support. The bears will need to create follow-through selling below the 20-month EMA to increase the odds of a retest of the October […]
Bitcoin en los $60000 tras una impresionante subida
Visión del mercado En nuestro último informe de Bitcoin, observamos con cautela el gran doji de enero como un posible doble techo, lo que generó preocupación por una reversión del precio. Sin embargo, febrero desafió las expectativas con una poderosa vela de ruptura alcista, impulsando el precio de $40,000 a unos asombrosos $60,000, ¡un notable […]
Nifty 50 Wedge Overshoot
Market Overview: Nifty 50 Futures Nifty 50 Wedge Overshoot on the monthly chart. The market on the monthly chart showed a very small bull close in February. Following the wedge overshoot, bulls managed to generate strong and consecutive bull bars, increasing the likelihood of a measured move up based on the bull breakout of the […]
FTSE 100 High 2 in Bull Trend, Expect More Up
Market Overview: FTSE 100 Futures FTSE 100 futures moved sideways last month in a doji after a High 2 in a small pullback bull trend. Tight trading range and many dojis but bull breakout and follow-through closing on their highs and above the MA so better to be long or flat. Bears can argue a […]
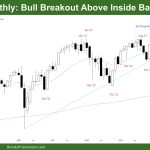
DAX 40 Bull Breakout Above Inside Bar
Market Overview: DAX 40 Futures DAX futures went higher last month with a bull breakout. Bears failed to get a double top and turn the trend into a trading range. Bulls will buy below and scale in, expecting the breakout gap to hold. Some bears sold the 3 bear bars and are scaling-in higher. It […]
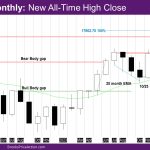
Nasdaq 100 Close above December 2021 Close
Market Overview: NASDAQ 100 Emini Futures The NASDAQ Emini futures February monthly candlestick is a non-climactic bull trend bar. It is a new all-time high close, with a close above December 2021 close, the prior all-time high close. The week is a bull trend bar with a bigger tail below and a smaller tail above. […]
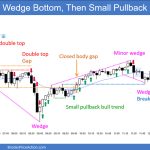
Emini Overlapping Bars
Trading Update: Friday March 1, 2024 S&P Emini pre-open market analysis Emini daily chart Emini 5-minute chart and what to expect today Yesterday’s Emini setups Al created the SP500 Emini charts. Here are reasonable stop entry setups from yesterday. I show each buy entry bar with a green arrow and each sell entry bar with […]
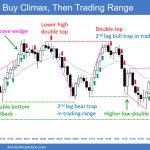
Emini Test of February 23rd
Trading Update: Thursday February 29, 2024 End of day video review S&P Emini pre-open market analysis Emini daily chart Emini 5-minute chart and what to expect today Yesterday’s Emini setups Al created the SP500 Emini charts. Here are reasonable stop entry setups from yesterday. I show each buy entry bar with a green arrow and […]
Emini Weak High 1 Buy Signal Bar
Trading Update: Wednesday February 28, 2024 End of day video review S&P Emini pre-open market analysis Emini daily chart Emini 5-minute chart and what to expect today Yesterday’s Emini setups Al created the SP500 Emini charts. Here are reasonable stop entry setups from yesterday. I show each buy entry bar with a green arrow and […]
Emini Bears Want Selloff Back to Moving Average
Trading Update: Tuesday February 27, 2024 S&P Emini pre-open market analysis Emini daily chart Emini 5-minute chart and what to expect today Yesterday’s Emini setups Al created the SP500 Emini charts. Here are reasonable stop entry setups from yesterday. I show each buy entry bar with a green arrow and each sell entry bar with […]
