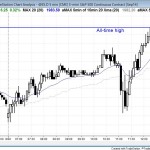
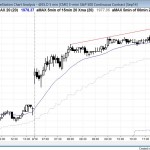
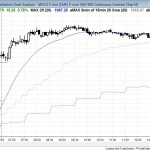
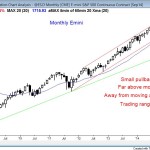
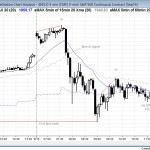
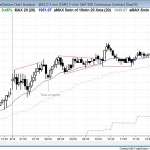
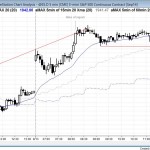
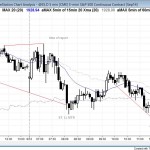
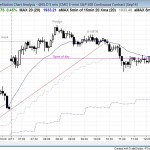
I posted this chart after the close. The S&P500 Emini sold off at 11 a.m. PST on the report, but then reversed up strongly to a new all-time high. There was a pullback into the close. End of day comments The Emini rallied until just before the 11 a.m. report. The stock market reversed down […]
Intraday market update, Tuesday, August 19, 2014: bull leg in a trading range
I posted this chart after the close End of day comments The Emini gapped up and pulled back briefly, and then the stock market rallied for for the rest of the day. The rally had many small bars and dojis, and the Emini spent much of the time within tight trading ranges. This reduced the […]
Intraday market update, Monday, August 18, 2014: trading range open
I posted this chart after the close. The Emini gapped above last week’s high, had a brief rally, and then entered a tight trading range. End of day comments The S&P500 Emini gapped above last week’s high, which was also Friday’s high. This created a potential measuring gap on both the daily and weekly charts. […]
Emini weekend update: Sunday, August 17, 2014: weak entry bar on weekly candle chart
Even though this is called a Sunday update, I finished it early and posted after Friday’s close. The weekly S&P500 Emini candle chart had a strong enough reversal down from the top of the bull trend channel so that it is likely to have a second leg sideways to down to the bottom of the […]
Intraday market update, Friday, August 15, 2014: daily lower high major trend reversal
I posted this chart after the close. After gapping up and forming an island bottom on the daily chart, the S&P500 Emini reversed down strongly in a sell vacuum that tested last week’s high. As I have said several times, last week was a weak buy signal bar when compared to the strong bear bar […]
Intraday market update, Thursday, August 14, 2014: Emini wedge top and bear trend reversal
I posted this chart after the close. The Emini had a bull trend opening reversal at the moving average, and then it had a relatively weak rally in a broad bull channel. The 7:50 a.m. wedge top and bear trend reversal failed. At 10:20 a.m., there was an exhaustive buy climax top just below a […]
Intraday market update, Wednesday, August 13, 2014: head and shoulders bottom
I posted this chart after the close. The bulls had a breakout above a two week double top, which is the neckline of a 60 minute head and shoulders bottom. However, the Emini entered a tight trading range for the rest of the day, with a little trend resumption up into the close. The close […]
Intraday market update, Tuesday, August 12, 2014: breakout mode trading range open
I posted this S&P500 Emini candle chart after the close. The Emini had a trending trading range day and closed near the open of the day, and therefore formed a doji candle on the daily chart. The second leg down was a channel and therefore the day was also a spike and channel bear trend. […]
Intraday market update, Monday, August 11, 2014: Emini weekly buy signal
I posted this chart after the close. The Emini rallied above last week’s high and therefore triggered a buy signal on the weekly chart. However, the rally was weak, and very late in a 2 day bull trend. It was therefore likely to be part of a trading range and not a strong bull trend. […]
Emini weekly update: Sunday, August 10, 2014: trend reversal down in a bull channel
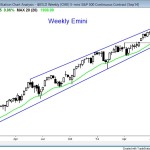
The weekly Emini candle chart is in a trend reversal down in a bull channel. It is finding support at the moving average and 1900, but the odds favor a move sideways to down to the bottom of the channel at a minimum. The Emini this past week found support at the 20 week moving […]
