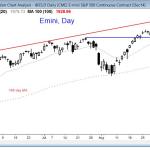
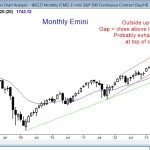
The monthly S&P500 Emini candle chart is in a strong bull trend but overbought The S&P500 Emini monthly chart is in a strong bull trend. It is too early to comment on this month’s candle other than to say the price action is overbought and the stock market will probably pull back soon. I have […]
Intraday market update, September 12, 2014: trading range price action
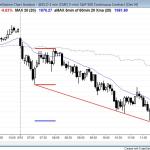
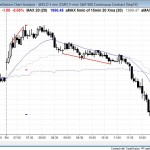
The Emini sold off at the open and then again from a wedge bear flag at 8 a.m. It traded down in a bear channel until noon, when it reversed up from a lower low major trend reversal. End of day comments about today’s Emini price action and day trading Today is a Friday, so […]
Intraday market update, September 11, 2014: lower high major trend reversal
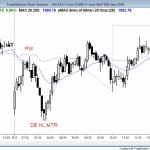
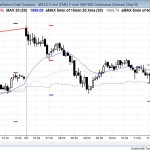
The rally on the open formed a lower high major trend reversal of yesterday’s bull channel. The Emini then sold off and formed double bottom with the open. The reversal up was a higher low major trend reversal of the 3 day bear trend. End of day comments about today’s Emini price action and day […]
Intraday market update, September 10, 2014: trading range open
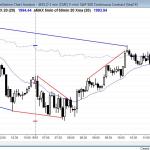
The Emini reversed up from below yesterday’s low. It stalled at a measured move up from the low to the open of the day, and at the bear trend line, and the 60 minute moving average, but then rallied into the close. End of day comments about today’s Emini price action and day trading The […]
Intraday market update, September 9, 2014: trend reversal at bottom of trading range
The Emini reversed up from the bottom of its two week trading range, but then broke to a new low of the day and fell below the July high. It rallied into the close off of the support of the July high and the daily moving average. End of day comments about today’s Emini price […]
Intraday market update, September 8, 2014: wedge top trend reversal
The Emini sold off from Friday’s wedge top and formed a trending trading range day. It rallied back into the upper range at the end of the day. End of day comments about today’s Emini price action and day trading The Emini fell from a lower high major trend reversal after yesterday’s wedge top. All […]
Emini weekend update: September 7, 2014: Bull trend but overbought
The monthly S&P500 Emini candle chart is in a strong bull trend but overbought The S&P500 Emini monthly chart is in a strong bull trend, although it is overbought. I have talked about three signs that the monthly chart is overbought. Only twice in the past 20 years has the S&P500 Emini been above the […]
Intraday market update, September 5, 2014: trading range day
After yesterday’s sell climax, the Emini reversed up strongly from a wedge bottom that formed just above last week’s low. End of day comments about today’s Emini price action and day trading The Wedge bottom was followed by a strong rally that tested a measured move up, and the Emini closed above the open of […]
Intraday market update, September 4, 2014: strong bull trend on the open
The S&P500 Emini rallied strongly on the open to a new high, but like all of the new highs over the past two weeks, there were enough sellers to turn the stock market back down. The rally was just a buy vacuum test of resistance (the new high and the top of the channel). The […]
Intraday market update, September 3, 2014: expanding triangle trend reversal
The S&P500 Emini sold off from the first bar with an expanding triangle trend reversal. End of day comments about today’s Emini price action and day trading The Emini sold off from the first bar of the day with an expanding triangle trend reversal, but then bounced up off of the 60 minute moving average […]
