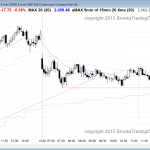
I will post around 6:56 a.m. The Emini triggered an expanding triangle bear flag short after the 2nd bar of the day. However, it reversed up 4 times from the bottom of the October 5 gap, and each time it did so from a lower low. The odds are that the bulls will not wait […]
Intraday market update: January 8, 2016
Intraday market update: January 7, 2016
Price action day traders see a sell climax
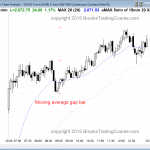
Posted 6:51 a.m. The Emini reversed up strongly on the 2nd bar after testing the October 5 gap. The follow-through has been weak, but when there is an extreme sell climax on the 60 minute chart and a strong reversal up at support on the daily chart, the day is not likely to be a […]
Intraday market update: January 6, 2016
Day trading tip is to expect a trend
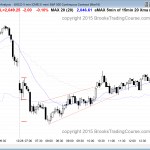
Posted 7:00 a.m. The Emini opened with a big gap down, but there were no bear bodies in the 1st 5 bars. This lowered the probability of bear trend day. However, there were 4 dojis. This lowered the probability of a strong bull trend day. Dojis are small trading ranges, and this open increases the […]
Intraday market update: January 5, 2016
Day trading tip is to expect more bullish price action
Posted 6:58 a.m. The Emini began with a tight trading range after yesterday’s consecutive buy climaxes. There is a 75% chance of at least a couple of hours of trading range price action beginning by the end of the 2nd hour, and it might have already begun. There is a 50% chance of follow-through buying […]
Intraday market update: January 4, 2016
Big gap down for Emini day traders
Posted 7:00 a.m. The Emini dipped below the December 17 higher low and found buyers. The bulls want a 60 minute double bottom higher low major trend reversal. The location at the bottom of a 3 month trading range is good for the bulls, as was the reversal up after the failed bear breakout. The […]
Emini weekend update: January 2, 2016:
Learn how to trade breakout mode price action
Monthly S&P500 Emini futures candlestick chart: Learn how to trade breakout mode price action The monthly S&P500 Emini futures candlestick chart has both a double top and a double bottom after a buy climax. The monthly S&P500 Emini futures candlestick chart held above its monthly moving average for 38 months, which has happened only twice […]
Intraday market update: December 31, 2015
Day trading strategy for trading range price action
Posted 7:02 a.m. The Emini opened with a gap down, but it was followed by several bars with prominent tails. This was weak follow-through selling and it reduces the chances of a strong bear trend. The Emini is Always In Short, but it is far below the moving average, it is forming a lot of […]
Intraday market update: December 30, 2015
Learn how to trade when the Emini is overbought
Posted 7:09 a.m. The Emini broke below yesterday’s bull channel and found support at the beginning of the channel. It formed an early tight trading range, which increases the chances that today’s price action will resemble that of the past 2 days. If so, day traders will mostly scalp, and many will enter with limit […]
Intraday market update: December 29, 2015
Learn how to trade a break above a wedge top
Posted 7:04 a.m. The Emini gapped up, but it quickly formed doji bars. This increased the chances of trading range price action for the next hour or so, and for the rest of the day, whether or not there is a swing up or down in the 1st hour or two. At the moment, the […]
Intraday market update: December 28, 2015
Learn how to trade a tight trading range during the holidays
Posted 7:31 a.m. Today had 2 reversals in the first 5 bars, creating a breakout mode open. The yearly chart still has a 60% chance of having last year’s close tested this week, which means that we will see a 20+ point drop from here at some point this week. The bears got a breakout […]


