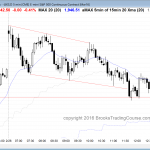
Posted 7:03 a.m. The Emini found buyers below yesterday’s low, which was likely, but the bulls have not yet been able to get a strong bull breakout. The early trading is a continuation of Friday’s trading range price action, and it increases the chances of a lot of trading range price action today. While it […]
Intraday market update: February 29, 2016
Emini weekend update: February 27, 2016:
Learn how to trade a bear rally
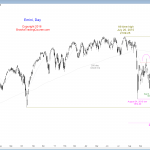
Monthly S&P500 Emini futures candlestick chart: Weak buy signal The candlestick on the monthly S&P500 Emini futures candlestick chart closes on Monday. February will be a weak buy signal candlestick pattern going into March. The monthly S&P500 Emini futures candlestick chart is in a bull trend, but it had an extreme buy climax that ended […]
Intraday market update: February 26, 2016
Learn how to trade a climactic breakout
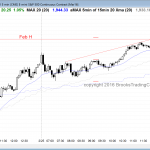
Posted 6:55 a.m. The Emini gapped up, but sold off on the open. Three of the 1st 4 bars were dojis. This is trading range price action, and it increased the chances for more trading range price action for the rest of the day. This is a trading range open. Online day traders want to […]
Intraday market update: February 25, 2016
Day traders expect a pullback in today’s price action
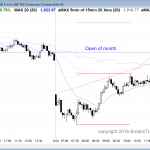
Posted 7:03 a.m. The Emini had a buy climax at the open that reversed down strongly from a wedge top. The 2 strong bear bars made the Emini Always In Short. Since yesterday’s bull channel was so tight, the odds are that the selloff will lead to a trading range rather than a bear trend. […]
Intraday market update: February 24, 2016
Learn how to trade a price action at support
Posted 7:12 a.m. The Emini got follow-through selling on the open, which happens about 50% of the time when there is a big gap down. There is a 75% chance of a trading range or early low of the day and only a 25% chance of a continued selloff. If there is a 2 hour […]
Intraday market update: February 23, 2016
Futures trading strategy at resistance
Posted 7:05 a.m. Yesterday was a sell signal bar for a double top with the February 1 high, and for a wedge rally over the past 2 weeks. The odds were that today would trigger the short by going below yesterday’s low, and then traders would look for either a selloff or a reversal up. […]
Intraday market update: February 22, 2016
Learn how to trade breakout price action
Posted 7:15 a.m. As I expected, the Emini went above the February 1 lower high early today. It is Always In Long and in a trend from the open bull trend. Five of the 1st 6 bars were small, which is a sign of trading range price action. A big gap up that rallies on […]
Emini weekend update: February 20, 2016:
Learn how to trade bullish price action at resistance
Monthly S&P500 Emini futures candlestick chart: Bull flag after buy climax The monthly S&P500 Emini futures candlestick chart is still in a tight trading range after a buy climax. There are 6 days left to the month. Although the candlestick pattern is currently a reversal bar this month, it might look completely different once the bar […]
Intraday market update: February 19, 2016
Learn how to day trade near support
Posted 7:05 a.m. After a gap down and a big bear bar, the Emini was in a trading range open. The 2nd bar of the day was the biggest bear bar in 100 bars. That makes it more likely an exhaustive end of the bear trend than the start of a new leg down. However, […]
Intraday market update: February 18, 2016
Learn how to trade price action in a micro channel
Posted 7:07 a.m. The Emini sold off on the open to below the bottom of the 4 hour trading range, which was the low of the last 2 hour bar. That was the 1st pullback in a 14 bar bull micro channel on the 120 minute chart. Traders do not yet know if the double […]

