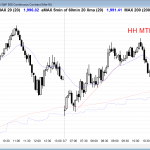
Posted 6:54 a.m. Although today gapped above last yesterday’s high and traded above last week’s high, it opened with a tight trading range and small bars. This makes it likely to have limited upside. Any reversal down would trigger an expanding triangle top and a failed breakout above last week’s high, but the bears will […]
Intraday market update: March 11, 2016
Intraday market update: March 10, 2016
Bullish price action for online day traders
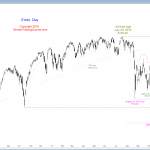
Posted 7:02 a.m. The Emini broke above yesterday’s high, triggering the High 1 buy setup on the daily chart, but because the 5 day rally was climactic, the Emini might need to pull back and form a High 2 buy setup before it can have its 3 – 5 day rally. The 1st 4 bars […]
Intraday market update: March 9, 2016
Day trading tip is to expect bullish price action
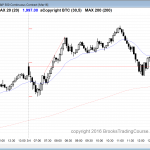
Posted 6:57 a.m. Today began with reversals, big bars, prominent tails, which is trading range price action, and it took place between the 5 and 60 minute moving averages. This increases the chance of more trading range price action throughout the day. The bulls want a higher low major trend reversal. The bears want another […]
Intraday market update: March 8, 2016
Learn how to trade a buy climax pullback
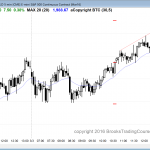
Posted 7:07 a.m. The Emini traded below yesterday’s low, creating the pullback on the daily chart. The odds are that it will be bought and be followed by a 1 – 3 day rally to above the March high, and then have a trading range. What we do not yet know is how far below […]
Intraday market update: March 7, 2016
Emini price action favors short day trades today
Posted 7:03 a.m. The Emini reversed up from the 60 minute moving average and rallied above Friday’s bear low, but the rally contained 3 dojis, and the buy signal bar was weak. This means that the rally was likely just a bear leg in a trading range. The selloff had a bull doji sell signal […]
Emini weekend update: March 5, 2016:
Learn how to trade a Low 4 sell climax candlestick pattern
Monthly S&P500 Emini futures candlestick chart: Middle of trading range The monthly S&P500 Emini futures candlestick chart is in the middle of its 2 year trading range after a 38 month buy climax. The monthly Emini chart is still recovering from a buy climax. It held above the 20 month EMA for 38 months, which […]
Intraday market update: March 4, 2016
Learn how to trade futures in a buy climax
Posted 7:02 a.m. The Emini reversed down on the open from the top of the 5 minute channel. Because the channel is tight, the odds favor a trading range before a bear trend, but since both the 60 minute and daily charts are in buy climaxes, there is a 70% chance of at least a […]
Intraday market update: March 3, 2016
Learn how to trade a wedge top candlestick pattern
Posted 7:01 a.m. The Emini began with a trend from the open bear trend in an overbought market. The sell signal bar was the 1st bar of the day and it had a tail. There was a pair of bull bars early on. Yesterday had a lot of trading range price action. This open so […]
Intraday market update: March 2, 2016
Learn how to trade a monthly buy signal
Posted 7:10 a.m. Trading range price action began with the 1st bar today. While it is still possible for the bulls to get follow-through buying at any point, there is a 75% chance of at least 2 hours of sideways to down trading beginning within the 1st 2 hours. The 2 or more hours of […]
Intraday market update: March 1, 2016
Learn how to trade a sell climax bull flag
Posted 6:57 a.m. The Emini opened with a big gap up, but went sideways in a limit order market. Unless the bears can get a strong reversal down, the odds are the any sideways to down move will form a higher low major trend reversal after yesterday’s lower low reversal. The bulls want a stop […]
