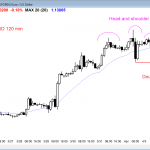
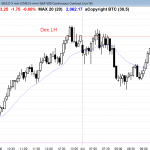
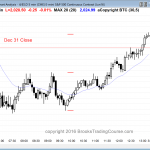
Posted 6:55 a.m. The Emini opened with a big gap down, and it sold off on the open. When there is a big gap down and an early selloff, the selloff usually lasts about 5 – 10 bars and then the Emini goes sideways to up to the moving average over the next couple of […]
Intraday market update: April 5, 2016
Intraday market update: April 4, 2016
Learn how to trade price action at the all time high
Posted 7:07 a.m. The bulls tried for follow-through buying on the open, but the rally lacked consecutive big bull trend bars. It is still unclear if there will be an hour or two rally and then a trading range, or if the 2 hour sideways to down price action has already begin. The odds of […]
Emini weekend update: April 2, 2016:
Swing traders see the buy climax candlestick pattern continuing
Monthly S&P500 Emini futures candlestick chart: Strong rally that is testing top of 2 year trading range The monthly S&P500 Emini futures candlestick chart rallied strongly in March and is testing the top of its 2 year trading range. The monthly S&P500 Emini futures candlestick chart has again rallied strongly to the top of its […]
Intraday market update: April 1, 2016
Candlestick pattern is a 2 day island top
Posted 6:57 a.m. The Emini opened with a big gap down and 3 bear bars, but both had big tails below, and bull scalpers made money buying at the low of the prior bar. That is not what typically happens in a bear trend. It increases the chances of the Emini being mostly sideways to […]
Intraday market update: March 31, 2016
Online day trading when the price action is quiet
Posted 7:01 a.m. The Emini began with a tight trading range within yesterday’s range. This increase the chances of a lot of trading range price action today. A trading range day has at least one leg up and one leg down, but it is impossible to know which will come 1st until after it has […]
Intraday market update: March 30, 2016
Day traders see the weekly candlestick pattern as a breakout
Posted 6:52 a.m. The Emini gapped up and rallied. When that happens, especially after a buy climax, the rally usually lasts 5 – 10 bars and then the Emini enters a tight trading range for a couple of bars. This is what is most likely today. It sometimes forms a parabolic wedge top and a […]
Intraday market update: March 29, 2016
Day trading tip is to look for scalping candlestick patterns
Posted 7:13 a.m. The Emini had a gap down and traded below yesterday’s low, but the 1st 5 bars had big tails below and were in a tight trading range. The Emini reversed up from a small double bottom for a failed breakout below yesterday’s low and a possible low of the day. The rally […]
Intraday market update: March 28, 2016
Learn how to trade after a buy climax
Posted 6:52 a.m. Thursday was a buy climax and today opened with a selloff from above Thursday’s high, even though Thursday was a buy signal bar on the daily chart. The odds are that the Emini will enter a trading range for the 1st 2 hours today, and then decide between trend resumption up and […]
Emini weekend update: March 26, 2016:
Learn how to trade a channel bear breakout
Monthly S&P500 Emini futures candlestick chart: Testing top of trading range The monthly S&P500 Emini futures candlestick chart has another week before this month closes, and the month so far is a strong bull trend bar. The monthly S&P500 Emini futures candlestick chart has a week to go before the candlestick closes. Although the candlestick […]
Intraday market update: March 24, 2016
Pullback price action for day traders
Posted 6:55 a.m. Today opened with a big gap down to around a measured move down based on yesterday’s range, and around the low of the bull channel of the past week. The bears failed to get continued early selling. This increased the chances for a sideways to up move to the moving average. The […]
