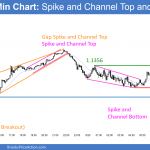
Posted 6:49 a.m. The Emini had a big gap up and then a couple of bull trend bars. This reduces the chances of a bear trend day. The bears need a strong bear breakout with follow-through, and this is unlikely at the moment. The Emini will probably be mostly sideways to up for the 1st […]
Trading Brexit price action
Emini weekend update: June 18, 2016:
Day trading strategies in the middle of a 4 month trading range
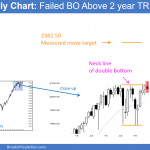
Monthly S&P500 Emini futures candlestick chart: Failed breakout The monthly S&P500 Emini futures candlestick chart has a small candlestick bar. It is a weak breakout above the 2 year range and a weak sell signal bar . The monthly S&P500 Emini futures candlestick chart has a micro double top with the April high at the […]
Intraday market update: June 17, 2016
Future trading strategies after a buy climax
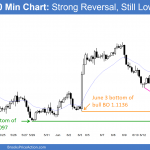
Posted 6:58 a.m. The Emini broke below yesterday’s bear channel and the 60 minute moving average on the open. Yesterday’s Spike and Channel bull trend is likely to transition into a trading range early today. The Emini formed a tight trading range in the middle of the final bull channel of yesterday. It is deciding […]
Intraday market update: June 16, 2016
Day trading a strong bear breakout
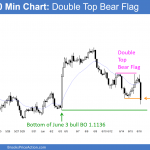
Posted 6:45 a.m. The Emini opened with a big gap down, far below the moving average. It is trying to test below the May 24 bull breakout bar. Whether or not it gets there early today, the Emini will probably be mostly sideways for the 1st 2 hours. That is what typically happens when there […]
Intraday market update: June 15, 2016
Day trading FOMC price action
Posted 7:10 a.m. The Emini gapped above the bull flag at the end of yesterday, but not above yesterday’s high or the 60 minute moving average. Although the early rally triggered the buy signal on the daily chart, it was a weak breakout above yesterday’s high. The rally on the open had small overlapping bars, […]
Intraday market update: June 14, 2016
Learn how to daytrade candlestick reversal patterns
Posted 6:49 a.m. The Emini gapped down, but closed the gap on the 2nd bar. This was also a failed breakout below yesterday’s bear channel. There is a 75% chance of the Emini reaching the top of the channel, and it can get there by going sideways or up. The Emini is Always In Long. […]
Intraday market update: June 13, 2016
Learn how to daytrade at support
Posted 8:58 a.m. The Emini reversed up from below yesterday’s low with a micro double bottom. The initial bars were big and there were several reversals. This is trading range price action and it increases the chances of mostly trading range price action for the 1st 2 – 3 hours. A trend can begin at […]
Emini weekend update: June 11, 2016:
Learn how to trade candlestick patterns with weak price action
Monthly S&P500 Emini futures candlestick chart: Learn how to trade candlestick patterns with weak price action The monthly S&P500 Emini futures candlestick chart is breaking above the top of a 2 year trading range in an overbought bull trend. The monthly S&P500 Emini futures candlestick chart is breaking above a 2 year trading range.The odds […]
Intraday market update: June 10, 2016
Learn how to trade developing price action reversals
Posted 6:52 a.m. The Emini opened with a big gap down just below the open of the week, which will probably be a magnet all day. Two of the 1st 3 bars had bull bodies. A big gap usually limits the movement for the 1st hour or two, and this early trading range price action […]
Intraday market update: June 9, 2016
Learn how to day trade strong price action
Posted 6:53 a.m. The Emini opened below yesterday’s low, but immediately closed the gap. By trading below yesterday’s low, the Emini triggered the micro double top sell signal on the daily chart. Since yesterday was a bull day and there has only been one small bear day in the past 11 days, there has not […]
